Wall Street Open: Kraft Heinz and O’Reilly Gain as Gold and Silver Slide
US equities edge higher at the open while the dollar firms, leaving commodities and crypto under broad technical selling pressure across 746 tracked assets.

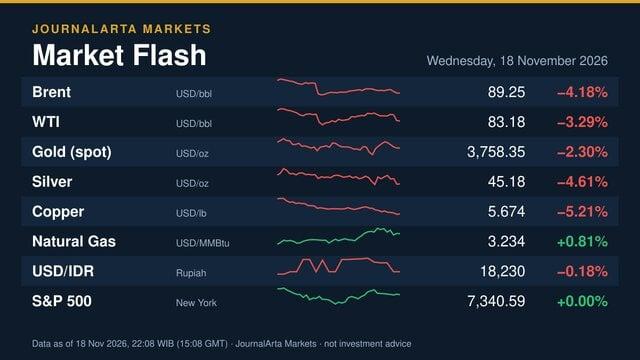
US equities opened modestly higher on 18 Nov 2026, with the S&P 500 up 0.25% at 7,359.21 and the Nasdaq gaining 0.67% to 24,490.56 as the Dollar Index firmed 0.23% to 103.72. That firmer dollar coincided with sharp declines across commodities and digital assets: WTI crude fell 3.50% to 83.00, spot gold dropped 2.13% to 3,764.92, and Bitcoin slid 1.92% to 63,630.38.
Across 746 assets tracked on the JournalArta Market Research board, technical breadth shows a sharp divergence between equities and hard assets. US stocks record 116 Buy setups against 65 Sell signals (338 Hold), led by defensive healthcare and consumer names such as Kraft Heinz and O'Reilly Automotive, while industrials like Eaton and semiconductors like GLOBALFOUNDRIES weaken. Australian stocks show 18 Buy vs 8 Sell setups, and UK, Singapore, and Hong Kong stocks post 29 Buy vs 19 Sell. By contrast, crypto shows just 1 Buy against 24 Sell setups, and commodities register 0 Buy and 13 Sell signals.
Key technical levels to watch this session:
- Whether O'Reilly Automotive (92.69) and Kraft Heinz (25.11) clear 20-day resistance at 92.70 and 25.44.
- Support tests in cyclical US names, including Eaton near 327.02 and BHP Group near AUD 54.38.
- Oversold follow-through in silver (RSI 28.4) and gold (RSI 30.9) after Bollinger and 20-day low breakdowns.
- Whether UNUS SED LEO holds its lone crypto uptrend while 24 peers remain in downtrends.
Top Picks: Buy
| Asset | Class | Ref. price | Entry zone | Target 1 / 2 | Stop loss | R/R | Valid until |
|---|---|---|---|---|---|---|---|
| The Kraft Heinz Company KHC · NYSE | Global stock | 25.11 USD | 24.55 – 25.11 | 27.76 / 30.42 | 23.34 | 1.5 / 3.0 | 16 Dec 2026 |
| O'Reilly Automotive, Inc. ORLY · NASDAQ | Global stock | 92.69 USD | 90.93 – 92.69 | 100.34 / 107.99 | 87.59 | 1.5 / 3.0 | 16 Dec 2026 |
| ResMed ResMed · ASX | Global stock | 35.50 AUD | 34.80 – 35.50 | 37.88 / 40.27 | 33.91 | 1.5 / 3.0 | 16 Dec 2026 |
| NEXT plc NXT · LSE | Global stock | 15,920.00 GBp | 15,648.97 – 15,920.00 | 16,841.54 / 17,763.08 | 15,305.64 | 1.5 / 3.0 | 16 Dec 2026 |
| UNUS SED LEO LEO | Crypto | 9.30093 USD | 9.18235 – 9.30093 | 9.70413 / 10.10733 | 9.03213 | 1.5 / 3.0 | 2 Dec 2026 |
The Kraft Heinz Company (KHC) — Buy
Kraft Heinz trades at 25.11 after a 3.59% five-day advance, holding a pullback above its SMA20 (24.59) and SMA50 (23.89) with rising OBV and a fresh positive MACD histogram flip. RSI at 58.8 leaves room before overbought territory. A break above 20-day resistance at 25.44 opens space toward 27.76 (TP1, 1.5 R/R) and 30.42 (TP2, 3 R/R), with the setup invalidated below 23.34.
Technical signals: MACD histogram has just turned positive; pullback to the SMA20 within an uptrend (price above SMA50); uptrend confirmed by rising OBV.
Risks:
- Failure to clear 25.44 resistance could trigger a range pullback toward 23.50 support.
- A close below the 23.34 stop-loss level breaks the 20-day support structure (7.05% risk).
- Nearest resistance at 25.44 sits below target 1.
Scenario is void if price falls to 23.34 or fails to revisit the entry zone within five sessions.
O'Reilly Automotive, Inc. (ORLY) — Buy
O'Reilly Automotive sits at 92.69, pressing directly against 20-day resistance at 92.70 after gaining 3.69% over five sessions. Price remains supported above the SMA20 (90.59) and SMA50 (87.84) with RSI at 61, rising OBV, and a new positive MACD histogram flip. Clearing 92.70 opens upside toward 100.34 (TP1, 1.5 R/R) and 107.99 (TP2, 3 R/R); invalidation sits below 87.59.
Technical signals: MACD histogram has just turned positive; pullback to the SMA20 within an uptrend (price above SMA50); uptrend confirmed by rising OBV.
Risks:
- Rejection at 92.70 resistance could pull price back toward the 90.93 entry floor.
- Moderate volatility (2.54% ATR) still leaves 5.5% downside risk to the 87.59 stop.
- Nearest resistance at 92.70 sits below target 1.
Scenario is void if price falls to 87.59 or fails to revisit the entry zone within five sessions.
ResMed (ResMed) — Buy
ResMed holds an uptrend at AUD 35.50 after rising 4.81% over five sessions, supported above its SMA20 (34.78) and SMA50 (33.25) with RSI at 62, rising OBV, and a fresh positive MACD histogram flip. A breakout above 20-day resistance at 35.91 targets 37.88 (TP1, 1.5 R/R) and 40.27 (TP2, 3 R/R). The bullish structure fails if price slips below 33.91.
Technical signals: MACD histogram has just turned positive; pullback to the SMA20 within an uptrend (price above SMA50); uptrend confirmed by rising OBV.
Risks:
- Overhead resistance at 35.91 could cap near-term momentum.
- A drop below the 34.80 entry floor puts the 33.91 stop-loss in focus (4.48% risk).
- Nearest resistance at 35.91 sits below target 1.
Scenario is void if price falls to 33.91 or fails to revisit the entry zone within five sessions.
NEXT plc (NXT) — Buy
NEXT plc maintains an uptrend at GBp 15,920, trading above its SMA20 (15,522.25) and SMA50 (15,033.90) with RSI at 60.3 and rising OBV confirming accumulation. Price is testing toward 20-day resistance at 16,050; a decisive push above that barrier opens targets at 16,841.54 (TP1, 1.5 R/R) and 17,763.08 (TP2, 3 R/R). The setup is invalidated below 15,305.64.
Technical signals: pullback to the SMA20 within an uptrend (price above SMA50); uptrend confirmed by rising OBV.
Risks:
- Failure at 16,050 resistance could trigger consolidation toward 15,648.97.
- A break under the SMA20 exposes the 15,305.64 stop-loss (3.86% risk).
- Nearest resistance at 16,050.00 sits below target 1.
Scenario is void if price falls to 15,305.64 or fails to revisit the entry zone within five sessions.
UNUS SED LEO (LEO) — Buy
UNUS SED LEO stands out as the sole buy setup among 50 tracked cryptocurrencies, trading at 9.30093 above its SMA20 (9.29) and SMA50 (9.12) with RSI at 56.6 and a contained 1.70% ATR. Clearing 20-day resistance at 9.42155 opens room toward 9.70413 (TP1, 1.5 R/R) and 10.10733 (TP2, 3 R/R). The setup is invalidated below 9.03213.
Technical signals: pullback to the SMA20 within an uptrend (price above SMA50).
Risks:
- Broad crypto weakness, with Bitcoin down 1.92%, could weigh on relative strength.
- Sideways trend structure risks range rejection near 9.42 resistance (2.89% risk).
- Nearest resistance at 9.42155 sits below target 1.
Scenario is void if price falls to 9.03213 or fails to revisit the entry zone within five sessions.
Top Picks: Sell
| Asset | Class | Ref. price | Sell zone | Target 1 / 2 | Stop loss | R/R | Valid until |
|---|---|---|---|---|---|---|---|
| Eaton Corporation plc ETN · NYSE | Global stock | 337.11 USD | 337.11 – 352.65 | 284.24 / 231.36 | 372.36 | 1.5 / 3.0 | 16 Dec 2026 |
| GLOBALFOUNDRIES Inc. GFS · NASDAQ | Global stock | 39.60 USD | 39.60 – 41.61 | 32.76 / 25.92 | 44.16 | 1.5 / 3.0 | 16 Dec 2026 |
| BHP Group BHP · ASX | Global stock | 54.57 AUD | 54.57 – 55.84 | 50.22 / 45.87 | 57.47 | 1.5 / 3.0 | 16 Dec 2026 |
| Diploma PLC DPLM · LSE | Global stock | 7,020.00 GBp | 7,020.00 – 7,154.78 | 6,486.08 / 5,952.15 | 7,375.95 | 1.5 / 3.0 | 16 Dec 2026 |
| Internet Computer ICP | Crypto | 2.244 USD | 2.244 – 2.383 | 1.670 / 1.095 | 2.627 | 1.5 / 3.0 | 2 Dec 2026 |
| Silver SI | Commodity | 45.765 USD/oz | 45.765 – 47.072 | 41.318 / 36.870 | 48.730 | 1.5 / 3.0 | 16 Dec 2026 |
| Gold GC | Commodity | 3,777.50 USD/oz | 3,777.50 – 3,852.57 | 3,522.23 / 3,266.96 | 3,947.68 | 1.5 / 3.0 | 16 Dec 2026 |
Eaton Corporation plc (ETN) — Sell
Eaton trades in a confirmed downtrend at 337.11, down 4.83% over five days and well below its SMA20 (364.07) and SMA50 (398.15). Falling OBV and a fresh negative MACD histogram flip accompany an RSI of 37.5. If selling pressure breaks 20-day support at 327.02, downside opens toward 284.24 (TP1, 1.5 R/R) and 231.36 (TP2, 3 R/R), while a move above 372.36 invalidates the bearish scenario.
Technical signals: MACD histogram has just turned negative; bounce into the SMA20 within a downtrend (price below SMA50); downtrend confirmed by falling OBV.
Risks:
- Elevated 6.15% ATR creates wide swings within the 337.11-352.65 entry zone.
- A rebound above the 364.07 SMA20 threatens the 372.36 stop-loss (10.46% risk).
- Nearest support at 327.02 sits above target 1.
Scenario is void if price rises to 372.36 or fails to revisit the sell zone within five sessions.
GLOBALFOUNDRIES Inc. (GFS) — Sell
GLOBALFOUNDRIES remains pressured in a downtrend at 39.60, trading beneath its SMA20 (42.41) and SMA50 (45.34) with RSI at 40.3, falling OBV, and a new negative MACD histogram flip. Any bounce into the 39.60-41.61 zone faces overhead supply. A drop toward and below 36.36 support opens room to 32.76 (TP1, 1.5 R/R) and 25.92 (TP2, 3 R/R), with invalidation above 44.16.
Technical signals: MACD histogram has just turned negative; bounce into the SMA20 within a downtrend (price below SMA50); downtrend confirmed by falling OBV.
Risks:
- High volatility (6.77% ATR) widens the stop distance to 44.16 (11.52% risk).
- Nasdaq strength (+0.67%) could spark a short-covering bounce above the SMA20.
- Nearest support at 36.36 sits above target 1.
Scenario is void if price rises to 44.16 or fails to revisit the sell zone within five sessions.
BHP Group (BHP) — Sell
BHP Group trades at AUD 54.57 after a 9.64% five-day drop, sitting just above 20-day support at 54.38 while well below its SMA20 (57.42) and SMA50 (59.46). A fresh negative MACD flip, falling OBV, and RSI at 37.5 reflect sustained selling pressure. Breaking 54.38 opens room toward 50.22 (TP1, 1.5 R/R) and 45.87 (TP2, 3 R/R); invalidation sits above 57.47.
Technical signals: MACD histogram has just turned negative; downtrend confirmed by falling OBV.
Risks:
- Proximity to 54.38 support could invite a technical bounce toward 55.84.
- Reclaiming the 57.42 SMA20 would negate the downtrend near the 57.47 stop (5.31% risk).
- Nearest support at 54.38 sits above target 1.
Scenario is void if price rises to 57.47 or fails to revisit the sell zone within five sessions.
Diploma PLC (DPLM) — Sell
Diploma PLC trades in a confirmed downtrend at GBp 7,020, down 4.36% over five days and below its SMA20 (7,161.50) and SMA50 (7,428.00). RSI at 40.1, falling OBV, and a new negative MACD flip align with bearish momentum. A break below 20-day support at 6,890 opens space toward 6,486.08 (TP1, 1.5 R/R) and 5,952.15 (TP2, 3 R/R), with invalidation above 7,375.95.
Technical signals: MACD histogram has just turned negative; bounce into the SMA20 within a downtrend (price below SMA50); downtrend confirmed by falling OBV.
Risks:
- Buyers may defend 6,890 support, prompting a bounce toward 7,154.78.
- Moving above 7,340 resistance invalidates the setup near the 7,375.95 stop (5.07% risk).
- Nearest support at 6,890.00 sits above target 1.
Scenario is void if price rises to 7,375.95 or fails to revisit the sell zone within five sessions.
Internet Computer (ICP) — Sell
Internet Computer trades in a steep downtrend at 2.244 after sliding 10.12% over five days, sitting below its SMA20 (2.43) and SMA50 (2.78) with RSI at 40.7, falling OBV, and a fresh negative MACD flip. Breaking 20-day support at 2.164 opens room toward 1.670 (TP1, 1.5 R/R) and 1.095 (TP2, 3 R/R) within its 14-day horizon. Invalidation sits above 2.627.
Technical signals: MACD histogram has just turned negative; bounce into the SMA20 within a downtrend (price below SMA50); downtrend confirmed by falling OBV.
Risks:
- Very high 8.27% ATR results in a wide 17.07% stop-loss distance at 2.627.
- Oversold bounces from 2.164 support could test the 2.383 upper entry bound.
- Nearest support at 2.164 sits above target 1.
Scenario is void if price rises to 2.627 or fails to revisit the sell zone within five sessions.
Silver (SI) — Sell
Silver sits at USD 45.765/oz after falling 3.22% on the day and 11.79% over five sessions, breaking its 20-day low on volume at least 1.5x average alongside a negative MACD flip and falling OBV. With RSI at 28.4 below the SMA20 (51.12) and SMA50 (57.27), momentum stays heavy toward 41.318 (TP1, 1.5 R/R) and 36.870 (TP2, 3 R/R). Invalidation sits above 48.730.
Technical signals: close below the 20-day low on volume at least 1.5× average; MACD histogram has just turned negative; downtrend confirmed by falling OBV.
Risks:
- Deeply oversold RSI at 28.4 increases the chance of a sharp relief bounce.
- Reclaiming 47.072 could pressure the 48.730 stop-loss (6.48% risk).
- Nearest support at 45.765 sits above target 1.
Scenario is void if price rises to 48.730 or fails to revisit the sell zone within five sessions.
Gold (GC) — Sell
Gold trades in a downtrend at USD 3,777.50/oz, down 2.24% on the day and 5.57% over five days after resolving a Bollinger squeeze below the lower band. Price sits well beneath the SMA20 (3,987.30) and SMA50 (4,143.88) with falling OBV and RSI at 30.9. Continued weakness opens space to 3,522.23 (TP1, 1.5 R/R) and 3,266.96 (TP2, 3 R/R), invalidated above 3,947.68.
Technical signals: Bollinger squeeze resolved with a close below the lower band; downtrend confirmed by falling OBV.
Risks:
- RSI near 30.9 warns of potential short-term mean reversion toward 3,852.57.
- Dollar Index reversal lower could support bullion back toward the 3,947.68 stop (4.51% risk).
Scenario is void if price rises to 3,947.68 or fails to revisit the sell zone within five sessions.
Today's Board at a Glance
The board scores 746 assets. Below are the buy and sell counts per asset class with the strongest scores.
| Class | Buy | Sell | Top buys | Top sells |
|---|---|---|---|---|
| US stocks | 116 | 65 | CNC, KHC, ORLY, MOH, AFL | APH, ETN, GFS, GPC, HUBB |
| Australian stocks (ASX) | 18 | 8 | ResMed, Cochlear, CommBank, IAG, Origin Energy | BHP, Coles, Fortescue, Rio Tinto, PLS Group |
| UK, Singapore & Hong Kong stocks | 29 | 19 | BNZL, NXT, MNG, ABF, BKG | DPLM, FCIT, AAL, ALW, ANTO |
| Crypto | 1 | 24 | LEO | ICP, ALGO, ARB, AVAX, BCH |
| Commodities | 0 | 13 | – | ALI, PL, SI, GC, SB |
Full buy and sell lists for every asset class →
Research Track Record
| Completed ideas (90 days) | 91 |
| Target 1 hit | 30 |
| Stopped out | 60 |
| Expired | 0 |
| Call reversed | 1 |
| Hit rate | 33.0% |
| Average result per idea | -0.09R |
| Active / awaiting entry | 640 |
| Entry not reached | 12 |
R = distance from entry to stop loss; +1.5R means a gain of 1.5 times the risk. Simulated on daily prices, before costs.
Levels are computed from daily data as of 18 Nov 2026 and hold while price stays near the entry zone.
Disclaimer: This research summary is compiled from exchange data and public information for information and education only. Upside and downside scenarios, reference zones, targets and risk levels describe model outputs; they are not investment advice or instructions to trade. Trading is high risk and capital can be lost. Decisions and their risks rest solely with the reader.
 Take the quizWhat Kind of Holiday Spender Are You? Take the Black Friday QuizStart →
- 1U.S. Emergency Alert Test Nov. 17 Is Not a Power Outage

- 2DUP Chairman Lord Morrow Loses Wife and Daughter Within Hours in NI

- 3NASA’s Curiosity Rover Burst Open a Rock and Found Pure Sulfur

- 4Women With Autoimmune Diseases Wait About 4 Years for Diagnosis, Study Finds

- 5Stock Market Today: Dow Futures Slip as Nasdaq Futures Climb Before Earnings

 Lifestyle · Food & Health4 Reasons to Eat Oatmeal, According to Nutrition Experts
 Lifestyle7 Signs Your Social Battery Is Running Low (and Why You Keep Cancelling Plans)
 Lifestyle · Food & HealthThanksgiving Food Safety: How Long Leftovers Last and the Safe Turkey Temperature
 Lifestyle7 Quiet Habits of Emotionally Intelligent People, According to Psychologists