AGL Energy Share Price Rises 0.11% on Wednesday, Near a 3-Month High
Technical analysis of AGL Energy stock on November 18, 2026: price 9.16 AUD, trend uptrend, RSI 59.8, support 8.84, resistance 9.25.
Why AGL Energy is in focus today
Selected automatically from 9 ASX (Australia) stocks by a technical-signal score with daily weighted randomisation — not a recommendation.
Trend & Price Action
The one-month return of 4.33% stands in contrast to the five-day loss of -0.97%, a divergence that describes a stock consolidating recent gains rather than one in retreat. AGL has pulled back modestly from its highs while holding comfortably above the 20-day average, a pattern that keeps the medium-term structure intact. No fresh moving-average crossover has formed, so the golden-cross condition — the 20-day average above the 50-day — is inherited rather than newly triggered, which argues for patience over urgency. The Bollinger setup is the detail to watch. Band width has narrowed to 4.0%, a squeeze that typically precedes a sharp directional move, though it offers no clue as to direction on its own. Price sits at 82% of the band range (%B), pressed near the upper band at 9.22 AUD. In a squeeze, a push through the upper band on expanding volume is the classic breakout signature; a failure to hold the mid-band at 9.04 AUD would flag the opposite.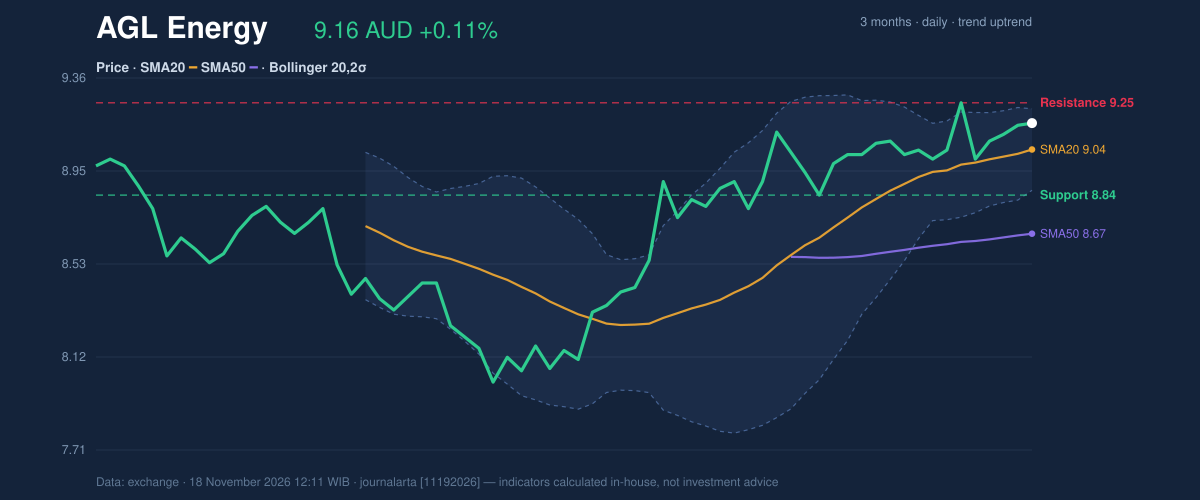
Oscillators & Momentum
Momentum is where the picture becomes more equivocal. The RSI at 59.8 sits in neutral territory between the 50 and 70 lines — firm enough to confirm the uptrend, not stretched enough to signal exhaustion. The Stochastic is similarly temperate, with %K at 73.5 and %D at 71.5, both neutral and neither overbought nor oversold. The MACD is the outlier. At 0.117 it remains above zero, but it has slipped below its signal line of 0.124, producing a histogram of -0.007. That is a negative momentum reading, and it means the short-term force behind the rally has cooled even as the trend structure holds. The code's bearish signal list flags exactly this: RSI rolling over from above 65. The takeaway is not that the uptrend has broken — it has not — but that the stock is pausing, and that the MACD divergence needs to resolve upward before the next leg higher can be trusted.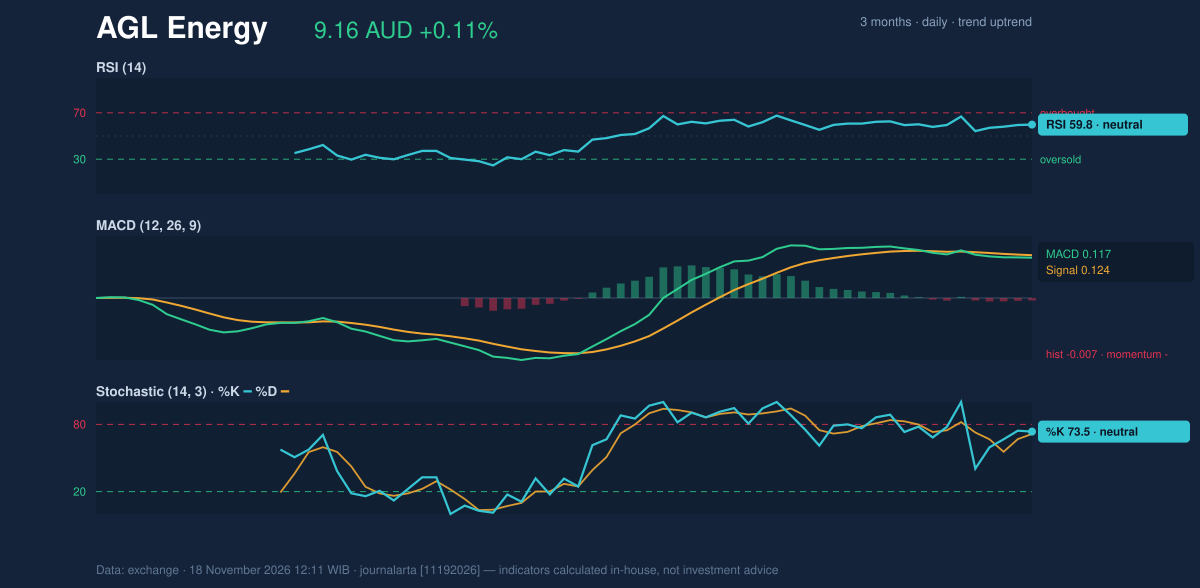
Volume & Volatility
Volume is the least reassuring input. The latest session traded 1,346,944 shares against a 20-day average of 2,662,825 — roughly half the normal pace. Thin volume undercuts the reliability of any price move, including the small gain on the day, because it suggests limited conviction on both sides of the book. The offset is that on-balance volume (OBV) is rising, meaning the cumulative volume flow still favours accumulation despite the muted daily turnover. Rising OBV with a contracting price range is not a contradiction; it is a market where sellers are absent rather than buyers aggressive. Volatility is moderate. ATR at 0.14 AUD represents 1.5% of the share price, so daily swings are contained, but the Bollinger squeeze signals that this calm is unlikely to persist. A breakout from the band would likely coincide with a pickup in ATR as well as volume — the combination to monitor.Key Levels & Scenarios
Two levels frame the immediate picture. On the upside, resistance sits at 9.25 AUD, which is also the three-month high; a close above it on volume would validate the squeeze breakout and open the path toward the mid-to-upper 9s. On the downside, support at 8.84 AUD marks the floor of the 20-day range, with the 20-day average at 9.04 AUD acting as the first line of defence. If price holds 9.04 and turns up, the pullback-to-the-average setup within an uptrend remains intact. If it breaks 8.84, the base of the range is compromised and the trend structure would need reassessment.Technical Verdict: BUY
The evidence supports a BUY call, scored +66 on JournalArta's −100 to +100 scale, driven by price above the 50-day average, a 20-day average above the 50-day, a confirmed uptrend, and RSI in the constructive 50–70 zone. Three factors carry the case: the trend structure is unbroken, with price above a rising 20-day average and that average above the 50-day; OBV is rising, confirming participation; and the pullback to the 20-day average is the textbook continuation entry within an uptrend. The invalidation condition is a break below 8.92 AUD, which would also breach the 20-day average and undercut the support cluster.- Entry range: 9.06 – 9.16 AUD
- Target 1: 9.52 AUD
- Target 2: 9.88 AUD
- Stop loss: 8.92 AUD
- Reward/risk: 1.5 / 3.0, valid until 16 December 2026
| Last price | 9.16 AUD |
| 1-day / 5-day / 1-month change | +0.11% / -0.97% / +4.33% |
| 20-day / 50-day SMA | 9.04 / 8.67 AUD |
| Bollinger bands (20, 2σ) | Upper 9.22 / Mid 9.04 / Lower 8.86 AUD; width 4.0% |
| RSI(14) / Stochastic %K–%D | 59.8 / 73.5–71.5 |
| MACD / signal / histogram | 0.117 / 0.124 / -0.007 |
| ATR(14) | 0.14 AUD (1.5% of price) |
| Volume / 20-day average | 1,346,944 / 2,662,825 |
| Support / resistance (20-day) | 8.84 / 9.25 AUD |
| 3-month high / low | 9.25 / 7.97 AUD |
| JournalArta verdict | BUY (+66) |
Summary Data AGL Energy
| Last price | 9.16 AUD |
| Change 1 day / 5 days / 1 month | 0.11% / -0.97% / 4.33% |
| Trend / MA-cross | uptrend / none |
| SMA20 / SMA50 | 9.04 / 8.67 |
| RSI (14) / Stochastic %K | 59.8 / 73.5 |
| Bollinger %B / ATR | 82% / 0.14 |
| Support / Resistance 20 days | 8.84 / 9.25 |
| Data as of | 18 November 2026 12:11 WIB |
| JournalArta research verdict (score) | Buy (+66) |
| Entry zone | 9.06 – 9.16 |
| Target 1 / 2 | 9.52 / 9.88 |
| Stop loss | 8.92 |
| Reward/risk | 1.5 / 3.0 |
Today's full Buy and Sell list for Australian stocks (ASX) →
Disclaimer: This technical analysis is generated automatically from exchange data and indicators calculated by JournalArta, for information and education only. The verdict and the entry, target and stop-loss levels are not investment advice or a solicitation to buy or sell any security. Investment decisions and their risks rest solely with the reader.
Track AGL Energy share price daily: live levels, support/resistance and our full AGL Energy analysis history.
 Take the quizWhat Kind of Holiday Spender Are You? Take the Black Friday QuizStart →
- 1U.S. Emergency Alert Test Nov. 17 Is Not a Power Outage

- 2Gold Silver Price November: Futures Rise Near Yearly Lows

- 3Michael Clarke Says Sandpapergate Scars Drew Steve Smith to New York

- 4GTA 6 New Zealand Time Trick Is Not Guaranteed to Work

- 5Sunrise on the Reaping Reviews Split Over Dark Hunger Games Prequel

 Lifestyle · Food & Health4 Reasons to Eat Oatmeal, According to Nutrition Experts
 Lifestyle7 Signs Your Social Battery Is Running Low (and Why You Keep Cancelling Plans)
 Lifestyle · Food & HealthThanksgiving Food Safety: How Long Leftovers Last and the Safe Turkey Temperature
 Lifestyle7 Quiet Habits of Emotionally Intelligent People, According to Psychologists