QBE Insurance Share Price Update: Falls 0.64%, Up 1.7% in a Month
Technical analysis of QBE stock on November 18, 2026: price 26.47 AUD, trend uptrend, RSI 58.0, support 25.40, resistance 26.87.

Why QBE is in focus today
Selected automatically from 9 ASX (Australia) stocks by a technical-signal score with daily weighted randomisation — not a recommendation.
Trend & Price Action
The most instructive feature of this setup is the pullback itself. QBE has eased back toward its 20-day average after pressing the 26.87 resistance — the top of its recent range — and that average has acted as a floor rather than a ceiling. A stock that retreats to its rising 20-day line without breaking it is typically consolidating, not reversing. Crucially, no new moving-average crossover has formed; the existing bullish alignment (price above the 20-day, 20-day above the 50-day) is simply being tested.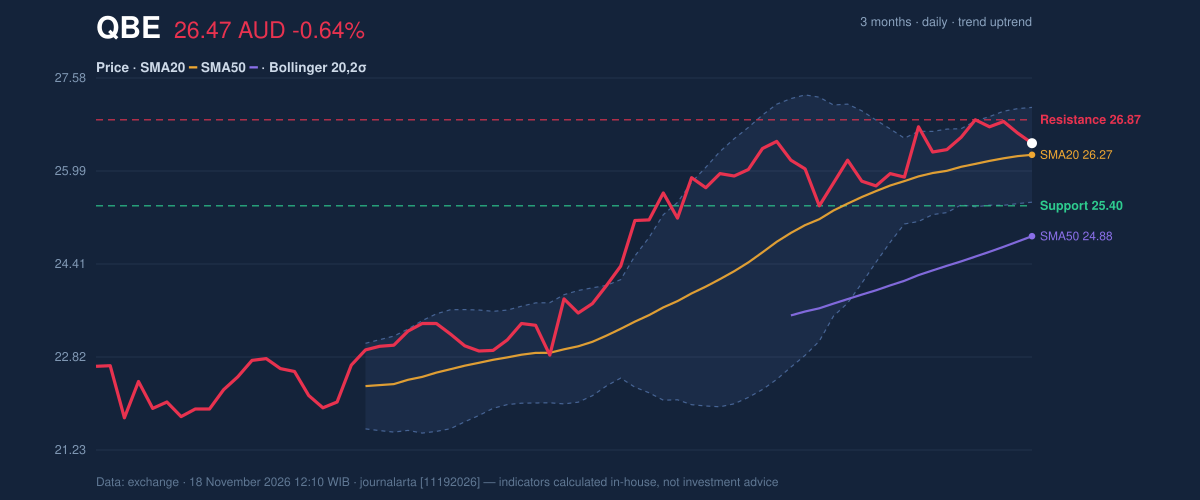
Oscillators & Momentum
Momentum is where the caution lives. The RSI(14) at 58.0 is squarely neutral, but the code-computed signals flag it as rolling over from above 65 — in plain terms, the buying pressure that pushed the stock higher has cooled. The MACD tells a similar story: at 0.484 it sits below its signal line of 0.536, with a negative histogram of -0.052. That is a short-term momentum loss, not a trend break, but it explains why the stock is drifting rather than advancing.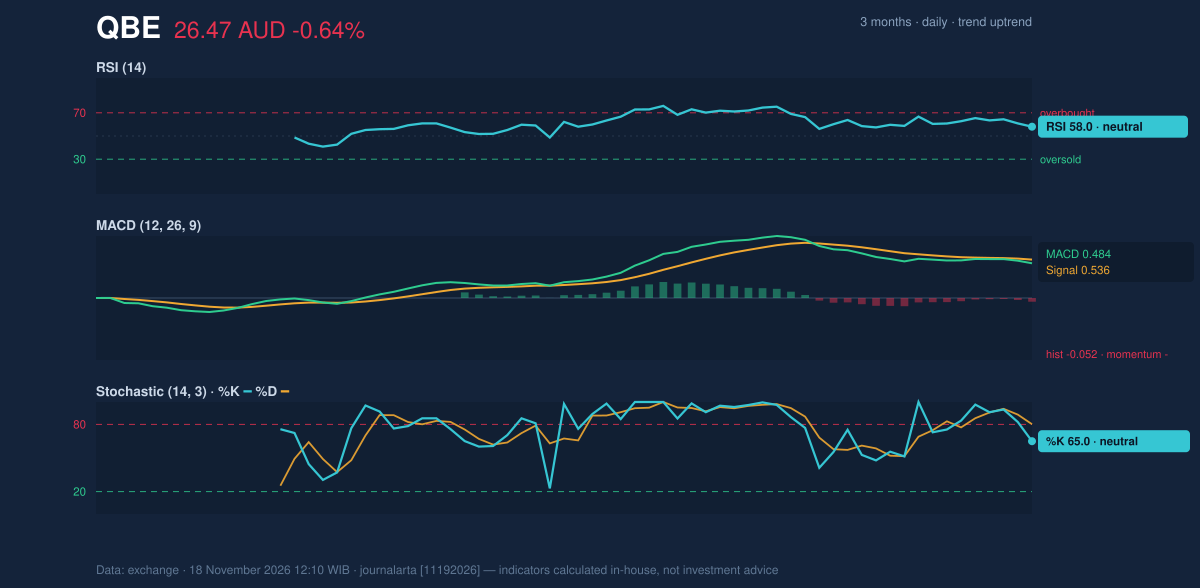
Volatility & Volume
The Bollinger bands are narrowing, with a width of 6.2% — a squeeze condition that historically precedes a larger directional move. Paired with an ATR of 0.48, or 1.8% of the price, volatility is moderate: the stock is not coiling violently, but it is coiling. The squeeze resolves in one of two directions, and the surrounding structure — price above both averages, rising OBV — tilts the odds toward an upward resolution. Volume at 0.9 times normal is thin, but OBV is rising, meaning the cumulative volume flow still favors buyers. Thin volume on a down day is far less concerning than thin volume on a rally; it suggests absence of sellers rather than presence of buyers.Key Levels & Scenarios
The map is unusually clean. A decisive close above 26.87 would open the path toward the Bollinger upper band at 27.08 and, beyond it, the three-month high at 26.96 — though the stock needs to clear the resistance cluster first. Failure to hold 25.40 would break the 20-day support and bring the lower band at 25.46 into play as the next reference, with the 50-day average at 24.88 as the deeper structural floor. The risk case is straightforward: if the RSI continues to roll over and the MACD histogram deepens negative, the consolidation could extend into a deeper test of the 50-day average. But that would require the price to lose the 20-day line first, and nothing in the current data suggests that is imminent.Technical Verdict: BUY
The verdict is BUY, aligned with the JournalArta research score of +66. Three reasons carry the call: the price sits above its 50-day average at 24.88 with the 20-day average above it — a textbook bullish alignment; the uptrend is confirmed by a rising OBV, showing accumulation beneath the surface; and the RSI at 58.0 remains in the healthy 50–70 zone, leaving room to run without being overbought. - Entry Range: 26.12 – 26.47 - Exit Targets: 28.22 (target 1) and 29.98 (target 2) - Stop Loss: 25.30 - Reward/Risk: 1.5 to 3.0 - Validity: through 16 December 2026 The verdict is invalidated if the price breaks below 25.30, which would undercut the 20-day support zone and question the uptrend structure. In plain English: the trend is up, the stock has paused rather than reversed, and the setup favors buyers as long as it holds above its recent support. This is technical analysis, not investment advice — the site disclaimer applies. The next scheduled event is the 16 December 2026 validity expiry, by which point the narrowing Bollinger squeeze should have resolved in one direction or the other.Summary Data QBE
| Last price | 26.47 AUD |
| Change 1 day / 5 days / 1 month | -0.64% / -0.38% / 1.73% |
| Trend / MA-cross | uptrend / none |
| SMA20 / SMA50 | 26.27 / 24.88 |
| RSI (14) / Stochastic %K | 58.0 / 65.0 |
| Bollinger %B / ATR | 62% / 0.48 |
| Support / Resistance 20 days | 25.40 / 26.87 |
| Data as of | 18 November 2026 12:10 WIB |
| JournalArta research verdict (score) | Buy (+66) |
| Entry zone | 26.12 – 26.47 |
| Target 1 / 2 | 28.22 / 29.98 |
| Stop loss | 25.30 |
| Reward/risk | 1.5 / 3.0 |
Today's full Buy and Sell list for Australian stocks (ASX) →
Disclaimer: This technical analysis is generated automatically from exchange data and indicators calculated by JournalArta, for information and education only. The verdict and the entry, target and stop-loss levels are not investment advice or a solicitation to buy or sell any security. Investment decisions and their risks rest solely with the reader.
Track QBE share price daily: live levels, support/resistance and our full QBE analysis history.
 Take the quizWhat Kind of Holiday Spender Are You? Take the Black Friday QuizStart →
- 1U.S. Emergency Alert Test Nov. 17 Is Not a Power Outage

- 2Gold Silver Price November: Futures Rise Near Yearly Lows

- 3Michael Clarke Says Sandpapergate Scars Drew Steve Smith to New York

- 4GTA 6 New Zealand Time Trick Is Not Guaranteed to Work

- 5Sunrise on the Reaping Reviews Split Over Dark Hunger Games Prequel

 Lifestyle · Food & Health4 Reasons to Eat Oatmeal, According to Nutrition Experts
 Lifestyle7 Signs Your Social Battery Is Running Low (and Why You Keep Cancelling Plans)
 Lifestyle · Food & HealthThanksgiving Food Safety: How Long Leftovers Last and the Safe Turkey Temperature
 Lifestyle7 Quiet Habits of Emotionally Intelligent People, According to Psychologists