Goodman Share Price Rises 0.14% on Wednesday, Up 10.6% in a Month
Technical analysis of Goodman Group stock on November 18, 2026: price 28.67 AUD, trend uptrend, RSI 57.0, support 25.27, resistance 29.45.

Why Goodman Group is in focus today
Selected automatically from 9 ASX (Australia) stocks by a technical-signal score with daily weighted randomisation — not a recommendation.
Trend & Price Action
The structure is textbook. Price trades above both the 20-day average at 27.69 and the 50-day average at 26.90, and the 20-day average itself rose 2.42% over the past five trading days — a slope that confirms buyers are still stepping up over time, not just holding a level. No new moving-average cross has formed; the bullish alignment of the 20-day above the 50-day was established earlier and remains intact. The pullback has been orderly. Support at 25.27 marks the bottom of the recent 20-day range, with the 3-month low further down at 24.70. Resistance sits at 29.45, and the stock trades at roughly 81% of that range — near the top, but not at the ceiling. Bollinger bands place the upper edge at 30.13 and the lower at 25.25, with the 3-month high of 31.30 above the band.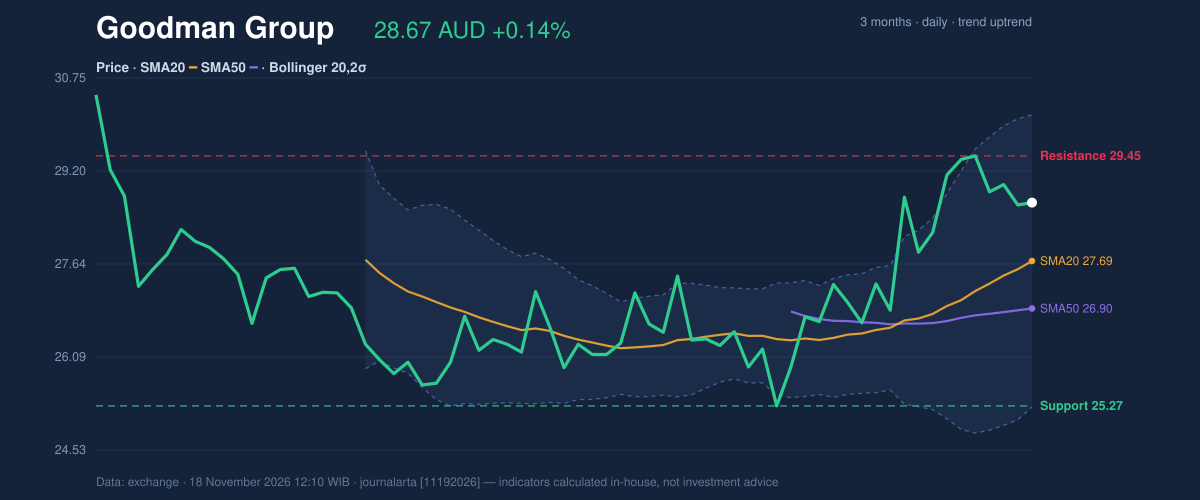
Oscillators & Momentum
RSI at 57.0 is the neutral zone — neither stretched nor weak. It has room to rise before overbought territory becomes a concern, which matters because the stock is only 2.45% off its recent best levels. Stochastic reads %K 75.0 against %D 77.8, a neutral pairing with the faster line slightly below the slower one — a mild pause, not a reversal signal. MACD tells the more constructive story: 0.616 against a signal line of 0.514, histogram positive at 0.102. Momentum is still pointing up, and the histogram has not flipped. When a stock pulls back while MACD stays positive, it usually describes consolidation within a trend rather than a trend change.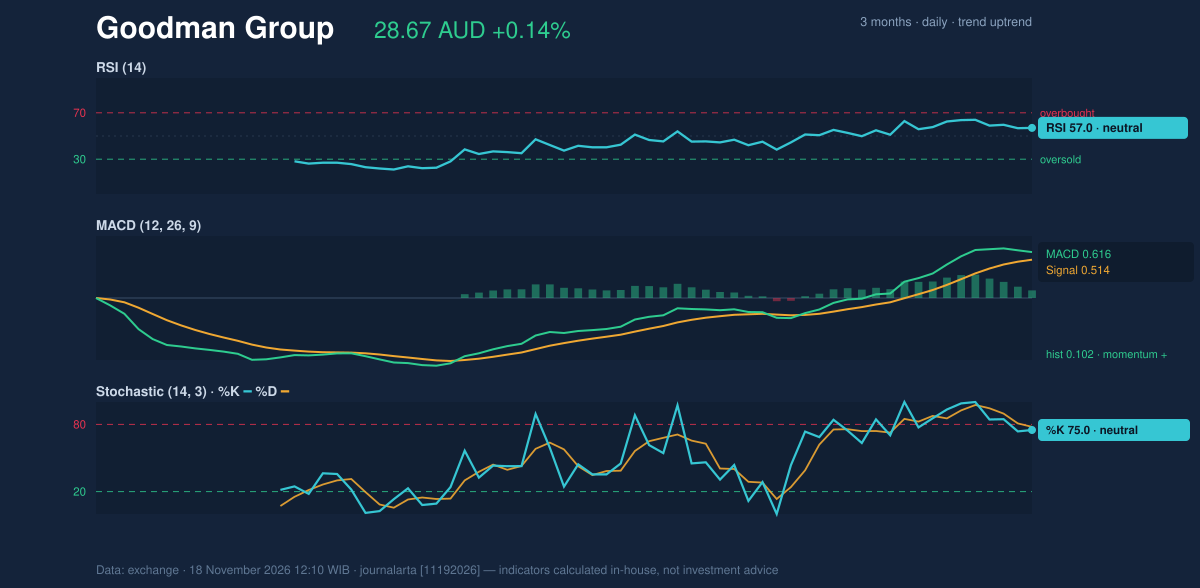
Volatility & Volume
Average true range stands at 0.92, or 3.2% of the price — moderate volatility, meaning daily swings are wide enough to shake out weak hands but not disorderly. Bollinger band width of 17.6% is classified normal; no squeeze is pending, so the next directional move is unlikely to be a sudden breakout from compression. Volume is the soft spot. The last session traded 3,610,187 shares against a 20-day average of 4,097,199 — about 0.9 times normal, or thin. A quiet tape during a pullback is often described as healthy, since it suggests sellers are not rushing for the exits; the absence of heavy selling volume is itself a signal. On-balance volume is rising, which means the cumulative flow of shares into up-days still outweighs distribution. That combination — falling short-term price, thin volume, rising OBV — is the classic footprint of a pause, not a top.Key Levels & Scenarios
The immediate battle line is the 20-day average at 27.69. A close that holds above it keeps the uptrend structure intact and sets up the case for a retest of 29.45. If that resistance breaks, the upper Bollinger band at 30.13 and the 3-month high of 31.30 come into view. On the other side, a break below 27.69 would put the 50-day average at 26.90 under scrutiny. Losing that would weaken the case materially, and the 20-day range support at 25.27 becomes the line that matters.Technical Verdict: BUY
The verdict is BUY, matching the JournalArta research score of +74. Three reasons carry it: price sits above the 50-day average inside a confirmed uptrend; the bullish signals outnumber bearish ones 2-0, with the pullback to the 20-day average and rising OBV cited as the bullish triggers; and MACD momentum remains positive with a constructive histogram. - Entry range: 27.98 – 28.67 - Exit target 1: 31.02 - Exit target 2: 33.38 - Stop loss: 27.10 - Reward/risk: 1.5 to 3.0 - Levels valid until 16 December 2026 The verdict is invalidated if price breaks and holds below 27.10. The chief risk is that thin volume — 0.9 times normal — leaves the stock without enough participation to push through 29.45, and RSI at 57.0 offers no momentum cushion if sentiment turns. Plainly: the trend is up, the pullback is holding at support, and the setup favors continuation — but only while 27.10 holds. This is technical analysis based on published market data, not investment advice.Summary Data Goodman Group
| Last price | 28.67 AUD |
| Change 1 day / 5 days / 1 month | 0.14% / -2.45% / 10.61% |
| Trend / MA-cross | uptrend / none |
| SMA20 / SMA50 | 27.69 / 26.90 |
| RSI (14) / Stochastic %K | 57.0 / 75.0 |
| Bollinger %B / ATR | 70% / 0.92 |
| Support / Resistance 20 days | 25.27 / 29.45 |
| Data as of | 18 November 2026 12:10 WIB |
| JournalArta research verdict (score) | Buy (+74) |
| Entry zone | 27.98 – 28.67 |
| Target 1 / 2 | 31.02 / 33.38 |
| Stop loss | 27.10 |
| Reward/risk | 1.5 / 3.0 |
Today's full Buy and Sell list for Australian stocks (ASX) →
Disclaimer: This technical analysis is generated automatically from exchange data and indicators calculated by JournalArta, for information and education only. The verdict and the entry, target and stop-loss levels are not investment advice or a solicitation to buy or sell any security. Investment decisions and their risks rest solely with the reader.
Track Goodman Group share price daily: live levels, support/resistance and our full Goodman Group analysis history.
 Take the quizWhat Kind of Holiday Spender Are You? Take the Black Friday QuizStart →
- 1U.S. Emergency Alert Test Nov. 17 Is Not a Power Outage

- 2Gold Silver Price November: Futures Rise Near Yearly Lows

- 3Michael Clarke Says Sandpapergate Scars Drew Steve Smith to New York

- 4GTA 6 New Zealand Time Trick Is Not Guaranteed to Work

- 5Sunrise on the Reaping Reviews Split Over Dark Hunger Games Prequel

 Lifestyle · Food & Health4 Reasons to Eat Oatmeal, According to Nutrition Experts
 Lifestyle7 Signs Your Social Battery Is Running Low (and Why You Keep Cancelling Plans)
 Lifestyle · Food & HealthThanksgiving Food Safety: How Long Leftovers Last and the Safe Turkey Temperature
 Lifestyle7 Quiet Habits of Emotionally Intelligent People, According to Psychologists