GSK Share Price Rises 0.00% on Friday, Golden Cross Formed
Technical analysis of GSK stock on November 6, 2026: price 1,890.00 GBp, trend uptrend, RSI 55.5, support 1,753.00, resistance 1,923.50.
GSK plc closed Friday's session on the London Stock Exchange (November 6, 2026) at 1,890.00 pence, unchanged from the previous close. A flat day hides the real story. The shares are up 1.89% over five days and 8.00% over one month, and a closely watched trend signal has just appeared on the chart.
Why GSK is in focus today
- Fresh golden cross: SMA20 crossed above SMA50
- Uptrend confirmed (5-day change 1.89%)
Selected automatically from 98 LSE (UK) stocks by a technical-signal score with daily weighted randomisation — not a recommendation.
That signal is a golden cross, formed two sessions before the latest session. The 20-day moving average, which tracks the recent average price, crossed above the 50-day average. Traders read it as short-term buying outpacing the longer-term trend.
Trend & Price Action
Price sits above both averages: the 20-day average at 1,856.58 and the 50-day at 1,842.40. The gap between the two is only about 14 pence, so the cross is real but young. It marks a change in direction rather than a proven, established trend. The 20-day average rose 1.42% over five days, a gentle slope that points to steady drift rather than a spike.
The stock trades at 80% of its 20-day range, between support at 1,753.00 and resistance at 1,923.50. It remains well below its three-month high of 2,158.00 and comfortably above the three-month low of 1,735.50. In plain terms, the recovery has room to run before it meets the bigger ceiling, but the nearest barrier is only 33.50 pence away.
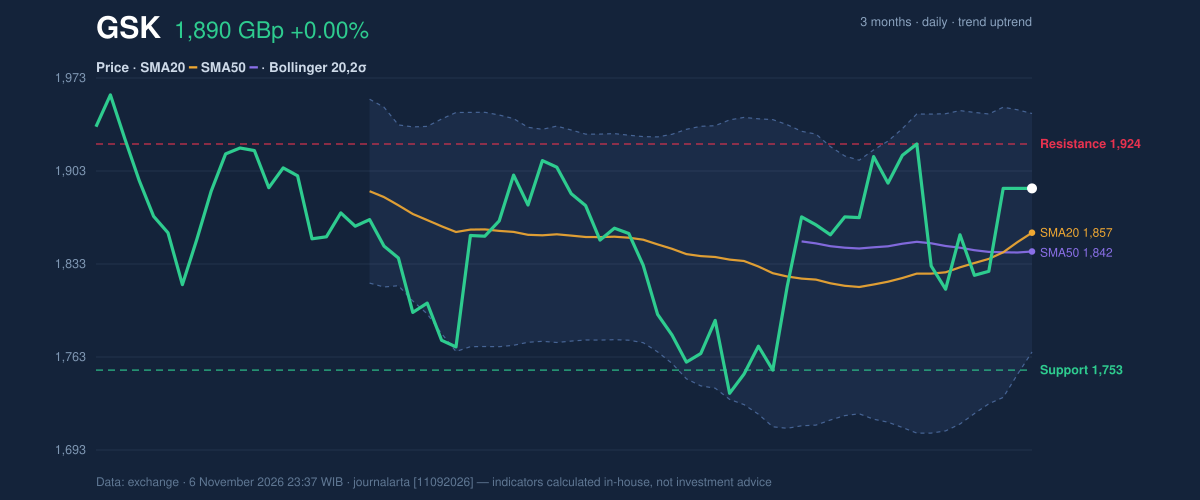
As shown in the chart, price has pulled back toward the 20-day line and held above it. This is often how healthy trends behave: a dip to the average, then a push higher.
Oscillators & Momentum
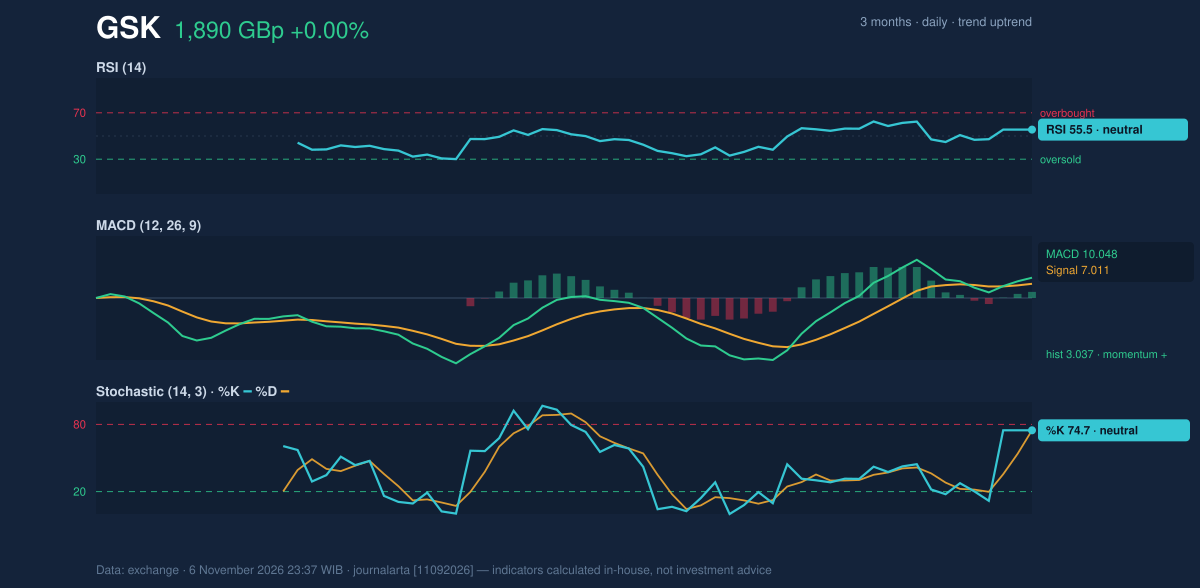
Momentum supports the trend without being stretched. The 14-day RSI is 55.5, in neutral territory. That means buyers have the upper hand but the stock is not overbought, so the rally is not yet running on fumes. The Stochastic oscillator reads 74.7 on both %K and %D. It is also neutral, though closer to its upper zone, which hints that near-term gains could slow if the stock reaches resistance.
The MACD line stands at 10.048 against a signal line of 7.011. The histogram of 3.037 is positive and has just turned that way, a sign that upward momentum is strengthening rather than fading. Taken together, the three gauges agree on direction and none flashes a warning.
Volatility & Volume
The Bollinger Bands, which draw a statistical envelope around price, run from 1,766.67 to 1,946.48. The %B reading of 69% places the share price in the upper half of that envelope. Band width is 9.7%, described as normal, so there is no squeeze pointing to an imminent breakout. The 14-day Average True Range (ATR) is 49.87 pence, or 2.6% of the price. That is moderate volatility, meaning daily swings of roughly that size are ordinary and should not be mistaken for a trend change.
Volume offers a mild caveat. Friday's turnover of 6,698,923 shares was 0.9 times the 20-day average of 7,709,822, slightly light. Yet on-balance volume, which adds volume on up days and subtracts it on down days, is rising. Money flow is therefore still tilting toward buyers, even if conviction on the day was modest.
Key Levels & Scenarios
The first test is 20-day resistance at 1,923.50. A sustained move above it would open the path toward the upper Bollinger Band at 1,946.48 and the level of price plus 1.5 times ATR at 1,964.80. Beyond that, the three-month high of 2,158.00 becomes the next reference. If the stock fails at 1,923.50, the 20-day average near 1,856.58 is the first cushion, followed by 1,815.20, which is price minus 1.5 times ATR. Below that sits 20-day support at 1,753.00.
Technical Verdict: BUY
The code-computed bias is BULLISH, with four of seven bullish signals and none bearish. The technical verdict is BUY, based on three indicators:
- Golden cross: the 20-day average crossed above the 50-day two sessions ago, with price holding above both.
- MACD: the histogram at 3.037 has just turned positive, confirming improving momentum.
- OBV: rising volume flow backs the advance, while RSI at 55.5 shows room before overbought conditions.
Reference levels derived strictly from the data:
- Ideal entry range: 1,856.58 (20-day average) to 1,890.00 (last price)
- Exit target: 1,923.50 (20-day resistance); 2,158.00 (three-month high) if price clears it
- Stop loss: below 1,815.20 (price minus 1.5×ATR); the wider safeguard is 1,753.00 (20-day support)
The verdict is invalidated if price falls below 1,815.20, which would also undercut the 20-day average and the 50-day average at 1,842.40. This is technical analysis, not an investment recommendation.
For non-traders: the chart currently favours a continued move higher for GSK, but the stock must clear 1,923.50 to confirm it.
| Indicator | Value |
|---|---|
| Last price | 1,890.00 GBp |
| Change (1 day / 5 days / 1 month) | 0.00% / 1.89% / 8.00% |
| SMA20 / SMA50 | 1,856.58 / 1,842.40 |
| Bollinger (upper / middle / lower) | 1,946.48 / 1,856.58 / 1,766.67 |
| RSI(14) | 55.5 |
| Stochastic %K / %D | 74.7 / 74.7 |
| MACD / signal / histogram | 10.048 / 7.011 / 3.037 |
| ATR(14) | 49.87 (2.6% of price) |
| 20-day support / resistance | 1,753.00 / 1,923.50 |
| 3-month low / high | 1,735.50 / 2,158.00 |
Summary Data GSK
| Last price | 1,890.00 GBp |
| Change 1 day / 5 days / 1 month | 0.00% / 1.89% / 8.00% |
| Trend / MA-cross | uptrend / golden |
| SMA20 / SMA50 | 1,856.58 / 1,842.40 |
| RSI (14) / Stochastic %K | 55.5 / 74.7 |
| Bollinger %B / ATR | 69% / 49.87 |
| Support / Resistance 20 days | 1,753.00 / 1,923.50 |
| Data as of | 6 November 2026 23:37 WIB |
Disclaimer: This technical analysis is generated automatically from exchange data and indicators calculated by JournalArta, for information and education only. The verdict and the entry, target and stop-loss levels are not investment advice or a solicitation to buy or sell any security. Investment decisions and their risks rest solely with the reader.
Track GSK share price daily: live levels, support/resistance and our full GSK analysis history.