Shell Share Price Falls 1.63%, Testing Support Level In Focus
Technical analysis of Shell stock on November 6, 2026: price 3,722.50 GBp, trend sideways, RSI 41.4, support 3,722.50, resistance 4,038.00.

Why Shell is in focus today
- Volume at 1.5× the 20-day average
- Closed at a 20-day low (3,722.50)
Selected automatically from 98 LSE (UK) stocks by a technical-signal score with daily weighted randomisation — not a recommendation.
Trend and Price Action
The broad trend reads as sideways, but the price has slipped to the lower edge of that range. The shares sit below the 20-day simple moving average (SMA20, the average closing price over 20 sessions) at 3,908.30, while still hovering just above the 50-day average at 3,701.70. That leaves the stock only about 21 pence above its longer-term average, the next cushion beneath the price. The 20-day average itself rose 0.75% over five days, so the medium-term slope has not rolled over. The recent decline is a sharp pullback within a flat structure, not yet a change in direction. No new moving-average crossover has formed. The stock now sits at 0% of its 20-day range, with support at 3,722.50 and resistance at 4,038.00. The three-month range runs from 3,253.00 to 4,110.00, so a close at the floor of the short-term range still leaves room above the quarterly low. As the chart shows, the price has dropped through the middle of its recent channel.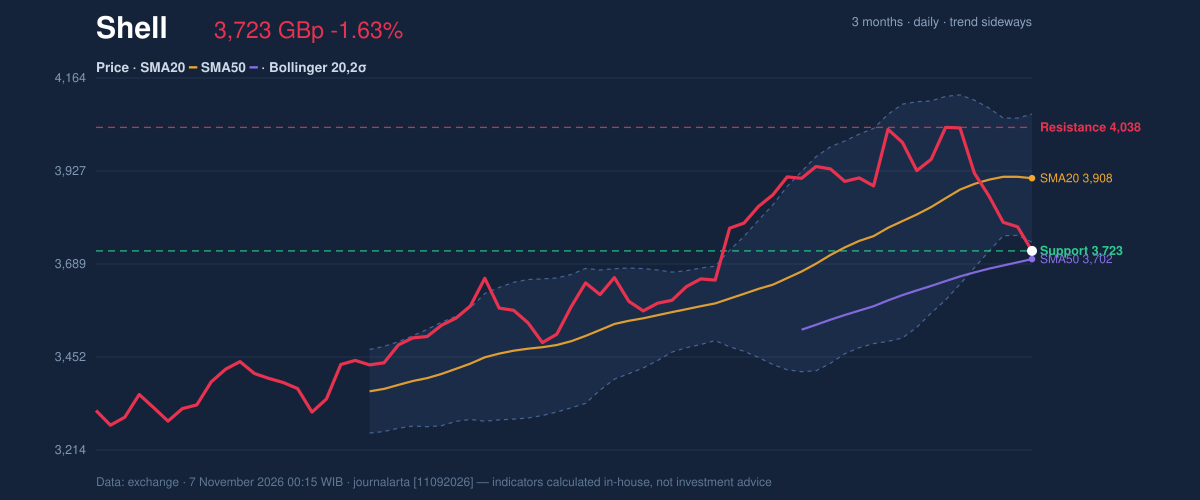
Oscillators and Momentum
Momentum indicators are split. The Relative Strength Index (RSI, a 0–100 gauge of recent buying versus selling pressure) is 41.4, which is neutral: it shows weakening, not capitulation. The Stochastic oscillator, which compares the close with the recent trading range, reads 12.8 for %K and 10.9 for %D, firmly oversold. In plain terms, the shares closed near the bottom of their recent range, which sometimes precedes a short-lived bounce but does not by itself signal a turn. The MACD, which tracks the gap between fast and slow price averages, shows a line of 34.159 below its signal line of 74.010, a histogram of -39.851. A negative histogram means downward momentum is still building, not fading. The code-computed technical bias is bearish, with three of seven bearish signals active, including an RSI that rolled over from above 65 and a close below the 20-day low on volume at least 1.5 times average. No bullish signals fired.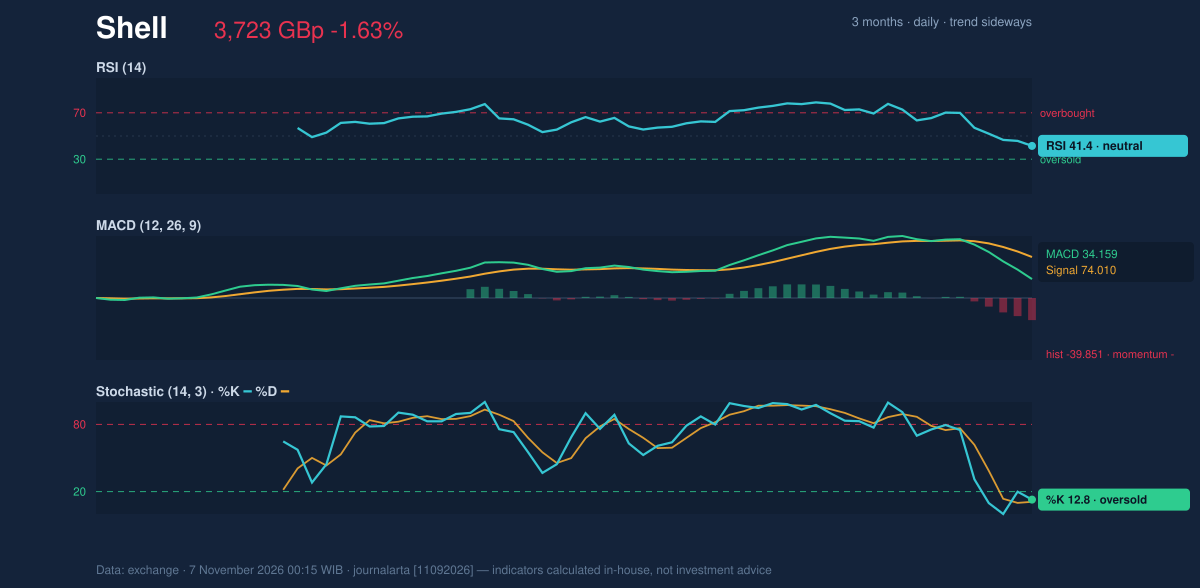
Volatility and Volume
The Bollinger bands, which sit two standard deviations either side of the 20-day average, span 3,744.80 to 4,071.80. Friday's close finished below the lower band, with %B at -7%, after a squeeze that had resolved downward. Band width is 8.4%, normal rather than stretched. A close outside the lower band shows an unusually strong move, though such moves can also snap back toward the average at 3,908.30. The Average True Range (ATR, the typical daily swing) is 93.46 pence, or 2.5% of the price, moderate volatility. The volume spike matters more. On-balance volume (OBV, a running tally that adds volume on up days and subtracts it on down days) is falling, so heavy trading is accompanying the decline, not a quiet drift lower. Volume and OBV together point to a move with real participation behind it.Key Levels and Scenarios
The immediate floor is the 20-day support at 3,722.50, which is also Friday's close. A further close below it would put the 50-day average at 3,701.70 in play, and the ATR-based level of 3,582.30 (price minus 1.5 times ATR) sits beneath that. The three-month low at 3,253.00 is the deeper marker. On the upside, a rebound would meet the lower Bollinger band at 3,744.80, the 20-day average at 3,908.30, then 20-day resistance at 4,038.00 and the three-month high of 4,110.00.Technical Verdict: SELL
The indicators lean toward SELL in technical terms, in line with the code-computed bearish bias:- MACD sits below its signal line with a histogram of -39.851, confirming negative momentum.
- The close below the lower Bollinger band on 1.5 times average volume, with falling OBV, shows participation behind the decline.
- The price is below the SMA20 and at the bottom of its 20-day range.
- Ideal entry range: 3,744.80 (lower Bollinger band) to 3,862.70 (price plus 1.5 times ATR)
- Exit target: 3,253.00 (three-month low), with 3,582.30 as an interim marker
- Stop loss: above 4,038.00 (20-day resistance)
Summary Data Shell
| Last price | 3,722.50 GBp |
| Change 1 day / 5 days / 1 month | -1.63% / -7.78% / -1.87% |
| Trend / MA-cross | sideways / none |
| SMA20 / SMA50 | 3,908.30 / 3,701.70 |
| RSI (14) / Stochastic %K | 41.4 / 12.8 |
| Bollinger %B / ATR | -7% / 93.46 |
| Support / Resistance 20 days | 3,722.50 / 4,038.00 |
| Data as of | 7 November 2026 00:15 WIB |
Disclaimer: This technical analysis is generated automatically from exchange data and indicators calculated by JournalArta, for information and education only. The verdict and the entry, target and stop-loss levels are not investment advice or a solicitation to buy or sell any security. Investment decisions and their risks rest solely with the reader.
Track Shell share price daily: live levels, support/resistance and our full Shell analysis history.