National Grid Share Price Rises 0.95% (November 13, 2026): Up 2.4% in Five Sessions
Technical analysis of National Grid stock on November 13, 2026: price 1,279.00 GBp, trend uptrend, RSI 65.8, support 1,189.50, resistance 1,285.50.
National Grid closed Friday's session on 13 November 2026 at 1,279.00 GBp on the London Stock Exchange, up 0.95% on the day from a previous close of 1,267.00. The gain extends a run of 2.36% over five days and 5.05% over one month. JournalArta's screening flags the stock because its trend is confirmed by rising on-balance volume (OBV), a measure of whether volume is flowing in on up days. Our code counts one bullish technical signal against none bearish.
Why National Grid is in focus today
Selected automatically from 7 LSE (UK) stocks by a technical-signal score with daily weighted randomisation — not a recommendation.
Trend & Price Action
The structure is clean. The price sits above both the 20-day average at 1,241.58 and the 50-day average at 1,184.76, and the 20-day average is itself above the 50-day. That ordering is what analysts mean by an uptrend: recent buyers are paying more than the average buyer of the past two months. The 20-day average rose 1.46% over five days, so the slope is positive, though not steep.
There is no fresh moving-average crossover in the data. The trend is not the product of a one-day signal; it has been in place for some time, and Friday's session added to it rather than starting it.
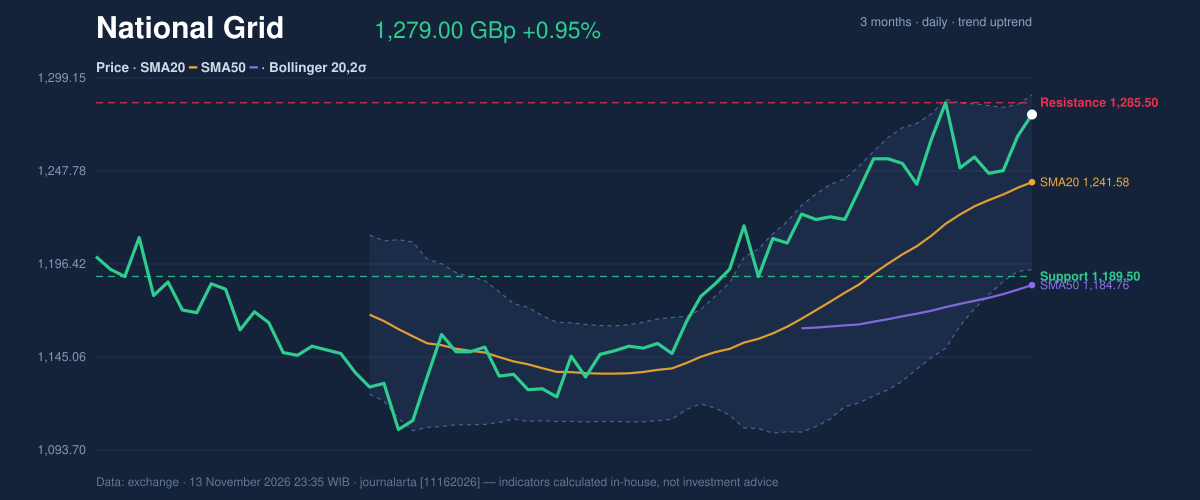
As the chart shows, the stock is pressing against the upper edge of its recent range. The 20-day support sits at 1,189.50 and the 20-day resistance at 1,285.50, and the close at 1,279.00 places the price at 93% of that span. The three-month high is 1,302.50 and the low 1,096.50. Resistance is therefore only 6.50 pence above the close, with the three-month peak a little further out.
Oscillators & Momentum
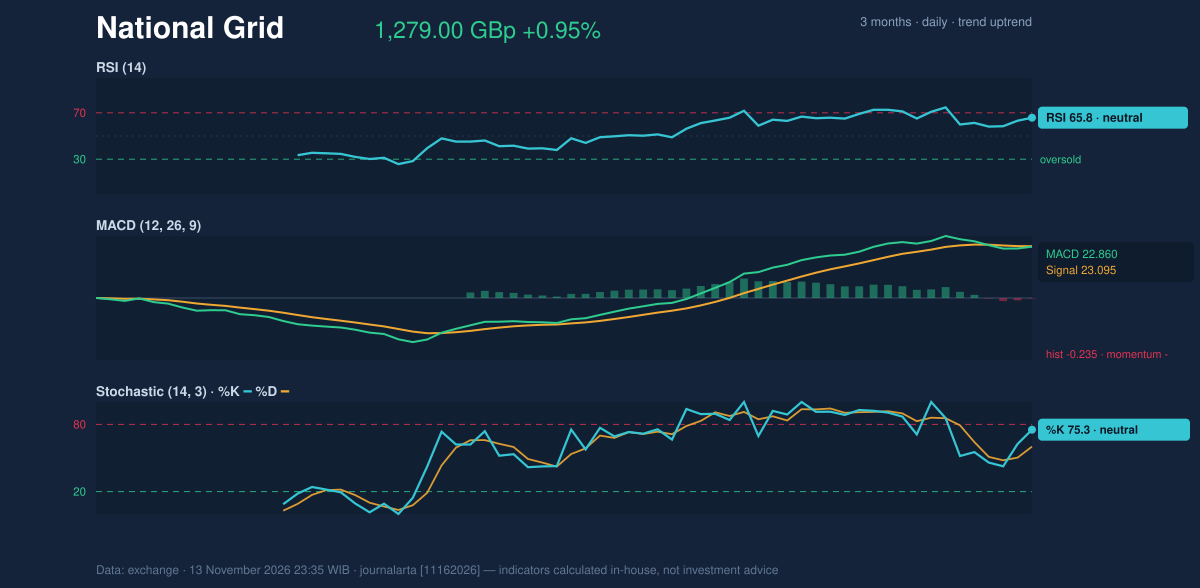
Momentum is positive but not stretched. The 14-day Relative Strength Index (RSI), which scores recent gains against losses on a 0–100 scale, reads 65.8. That is neutral by our classification: strong, yet below the 70 level that traders usually treat as overheated. The Stochastic oscillator, which shows where the close sits within its recent high-low range, gives a %K of 75.3 against a %D of 60.2. Both are neutral, with the faster line above the slower one, a sign that short-term buying pressure is still building.
The one blemish is the MACD (moving average convergence divergence). Its line reads 22.860 against a signal line of 23.095, leaving a histogram of -0.235. The gap is tiny, but it means short-term momentum is marginally negative even as the price grinds higher. In plain terms, the rally has not accelerated, and a stock near resistance with fading acceleration can stall.
Volatility & Volume
Bollinger Bands, which draw a channel two standard deviations around the 20-day average, run from 1,193.34 to 1,289.81 with the midpoint at 1,241.58. The close gives a %B reading of 89%, meaning the price is near the top of the channel. The bands are also narrowing, with a width of 7.8%. A squeeze like this often precedes a sharper move, though it does not indicate direction. Given the position of the price, the upper band at 1,289.81 is the first test.
Average True Range (ATR), a gauge of typical daily movement, is 24.86 pence, or 1.9% of the price. That is moderate volatility, and it implies that the distance to the nearest resistance is within a normal day's swing.
Volume is the weaker leg. Friday's turnover of 5,726,194 shares was only 0.5 times the 20-day average of 10,841,261, a thin session. Yet OBV is rising, so the accumulated flow over recent weeks still favours buyers. A breakout on light volume would carry less conviction than one on heavy volume, which is the main caution here.
Key Levels & Scenarios
If the price clears the 20-day resistance at 1,285.50 and the upper Bollinger band at 1,289.81, the three-month high of 1,302.50 comes into view. If it fails to hold the 20-day average near 1,241.58, the uptrend loses its nearest support, and the 20-day floor at 1,189.50 becomes relevant.
Technical Verdict: BUY
JournalArta's research model scores National Grid at +76 on a scale of -100 to +100, above the +60 threshold for a BUY call. The strongest reasons:
- Trend structure: the price is above the 50-day average, and the 20-day average is above the 50-day.
- RSI at 65.8: inside the 50–70 zone, showing strength without overheating.
- OBV rising: volume flow confirms the uptrend.
The verdict is invalidated if the price falls below the stop-loss level of 1,236.81. The negative MACD histogram and thin volume are the risks to watch.
- Entry range: 1,260.40 – 1,279.00 GBp
- Exit target 1: 1,342.28 GBp (reward/risk 1.5)
- Exit target 2: 1,405.57 GBp (reward/risk 3.0)
- Stop loss: 1,236.81 GBp
For non-traders: the price pattern is positive and the model rates it favourably, but this is technical analysis, not investment advice, and the call is valid only until 11 December 2026.
Summary Data National Grid
| Last price | 1,279.00 GBp |
| Change 1 day / 5 days / 1 month | 0.95% / 2.36% / 5.05% |
| Trend / MA-cross | uptrend / none |
| SMA20 / SMA50 | 1,241.58 / 1,184.76 |
| RSI (14) / Stochastic %K | 65.8 / 75.3 |
| Bollinger %B / ATR | 89% / 24.86 |
| Support / Resistance 20 days | 1,189.50 / 1,285.50 |
| Data as of | 13 November 2026 23:35 WIB |
| JournalArta research verdict (score) | Buy (+76) |
| Entry zone | 1,260.40 – 1,279.00 |
| Target 1 / 2 | 1,342.28 / 1,405.57 |
| Stop loss | 1,236.81 |
| Reward/risk | 1.5 / 3.0 |
Today's full Buy and Sell list for UK, Singapore & Hong Kong stocks →
Disclaimer: This technical analysis is generated automatically from exchange data and indicators calculated by JournalArta, for information and education only. The verdict and the entry, target and stop-loss levels are not investment advice or a solicitation to buy or sell any security. Investment decisions and their risks rest solely with the reader.
Track National Grid share price daily: live levels, support/resistance and our full National Grid analysis history.
 Take the quizWhat Kind of Holiday Spender Are You? Take the Black Friday QuizStart →
- 1I’m A Celebrity 2026 Line-Up: Rooney Leads 11 Stars Into Jungle

- 2Mavericks Surfers Race to California for Waves Near 50 Feet

- 3NYC Medical Examiner Has Not Determined Cause of Death of Beau Rose Jessup

- 4Mountaineer Finds Ice Age Cave Bear Graveyard in the Dolomites

- 5Rugby League World Cup Final 2026: Kick-Off Times and How to Watch Kangaroos v New Zealand

 Lifestyle7 Signs Your Social Battery Is Running Low (and Why You Keep Cancelling Plans)
 Lifestyle · Food & HealthThanksgiving Food Safety: How Long Leftovers Last and the Safe Turkey Temperature
 Lifestyle7 Quiet Habits of Emotionally Intelligent People, According to Psychologists
 LifestylePeople Who Don’t Like Celebrating Their Birthday Often Share These 7 Traits