Stockland Share Price Update: Rises 1.11%, Up 12.3% in a Month
Technical analysis of Stockland stock on November 16, 2026: price 4.56 AUD, trend uptrend, RSI 61.5, support 4.13, resistance 4.60.
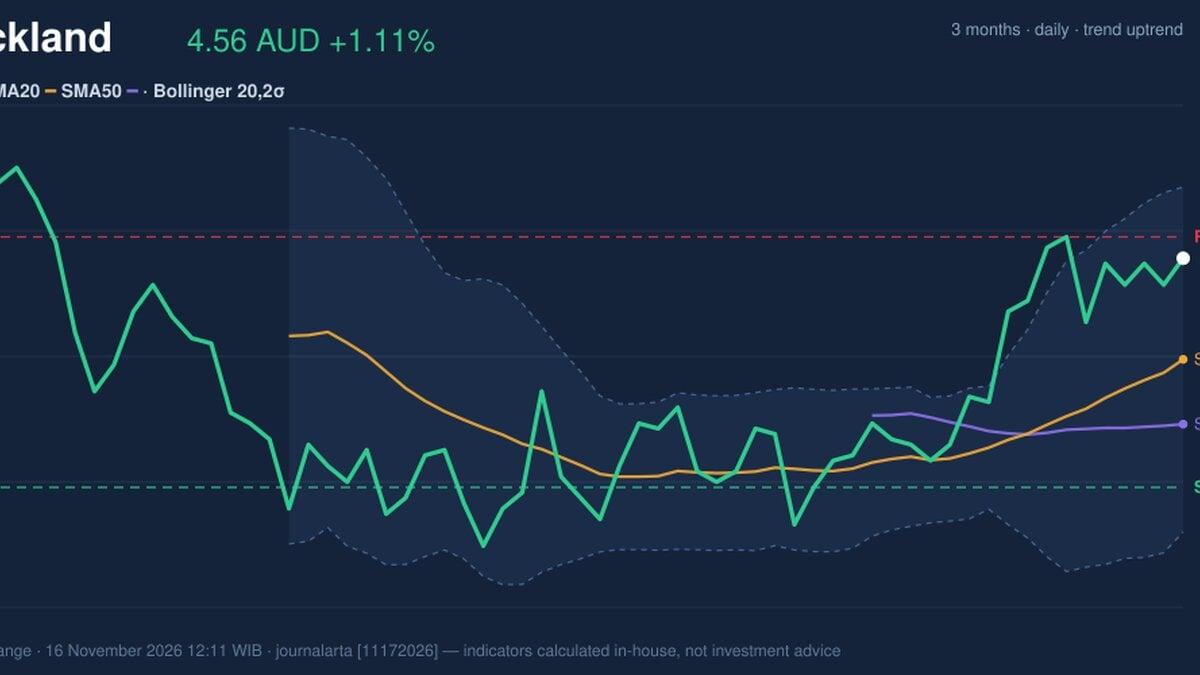
Why Stockland is in focus today
Selected automatically from 6 ASX (Australia) stocks by a technical-signal score with daily weighted randomisation — not a recommendation.
Trend & Price Action
Stockland remains in an uptrend. Its price is above the 20-day average of A$4.37 and the 50-day average of A$4.25, while the 20-day average itself rose 2.16% over five days. The higher short-term average and rising price point to sustained upward pressure. No new moving-average crossover has formed, however, so the current signal comes from the established alignment rather than a fresh technical event. There is room to run, but not much before the nearest marked ceiling. At A$4.56, the stock is at 91% of its 20-day range, with support at A$4.13 and resistance at A$4.60. Its three-month high is A$4.73, making the area above resistance a test of whether the advance can extend toward that earlier peak.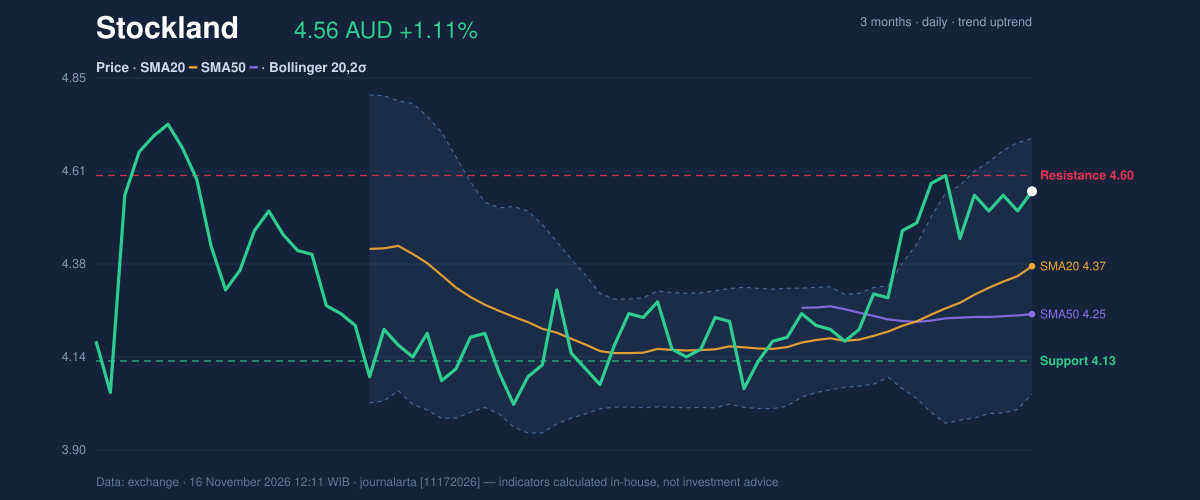
Oscillators & Momentum
The indicators broadly confirm the trend, though they differ on how stretched the move has become. The RSI is 61.5, in neutral territory: it reflects positive momentum without, by itself, signaling an extreme. The Stochastic is overbought, with %K at 84.3 and %D at 80.4, suggesting the recent run may have moved ahead of its shorter-term pace. The MACD is positive at 0.093, above its 0.076 signal line, with a positive histogram of 0.016. That supports the upward direction. Together, the readings point to an advance with positive underlying momentum, but one that could be vulnerable to consolidation if buyers hesitate near resistance.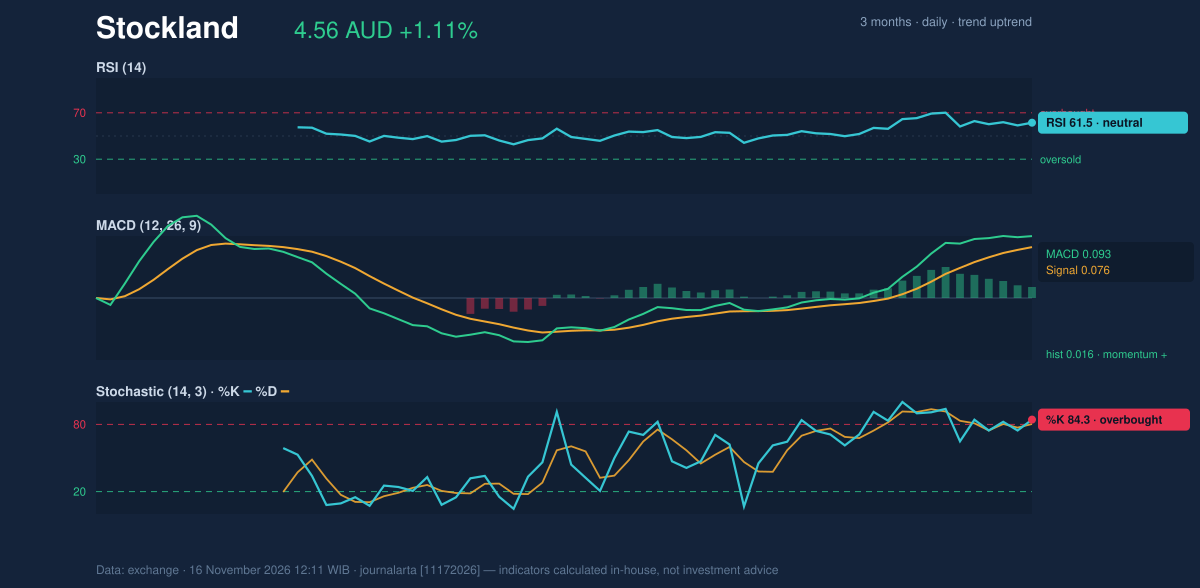
Volatility & Volume
Volatility is moderate. The average true range is A$0.12, or 2.7% of the share price. Bollinger Bands are at normal width, with the price nearer the upper band: %B is 79%, between the middle band at A$4.37 and upper band at A$4.69. The normal-width bands show no squeeze signal, while the upper band and resistance area frame the near-term test. Trading volume was 4.7 million shares, about half the 20-day average of 9.1 million, which the data classifies as thin. That means the latest rise came on below-average participation. On the other hand, rising OBV—the cumulative measure of volume flow—offers some confirmation that buying pressure has been building over the broader move.Technical Verdict: BUY
The JournalArta technical score is +76, in the data’s BUY range. The call is supported by the uptrend, the price above its 50-day average, the 20-day average above the 50-day, and RSI at 61.5. Rising OBV adds confirmation, while the overbought Stochastic, thin latest volume and nearby A$4.60 resistance are risks. The verdict is invalidated if the price falls below A$4.35.- Ideal entry range: A$4.47–A$4.56
- Exit targets: A$4.87 and A$5.19
- Stop-loss protection: A$4.35
- Validity: through December 14, 2026
Data
Stockland (ASX: SGP) closed at A$4.56 on Monday, November 16, 2026.Summary Data Stockland
| Last price | 4.56 AUD |
| Change 1 day / 5 days / 1 month | 1.11% / 2.70% / 12.32% |
| Trend / MA-cross | uptrend / none |
| SMA20 / SMA50 | 4.37 / 4.25 |
| RSI (14) / Stochastic %K | 61.5 / 84.3 |
| Bollinger %B / ATR | 79% / 0.12 |
| Support / Resistance 20 days | 4.13 / 4.60 |
| Data as of | 16 November 2026 12:11 WIB |
| JournalArta research verdict (score) | Buy (+76) |
| Entry zone | 4.47 – 4.56 |
| Target 1 / 2 | 4.87 / 5.19 |
| Stop loss | 4.35 |
| Reward/risk | 1.5 / 3.0 |
Today's full Buy and Sell list for Australian stocks (ASX) →
Disclaimer: This technical analysis is generated automatically from exchange data and indicators calculated by JournalArta, for information and education only. The verdict and the entry, target and stop-loss levels are not investment advice or a solicitation to buy or sell any security. Investment decisions and their risks rest solely with the reader.
Track Stockland share price daily: live levels, support/resistance and our full Stockland analysis history.
 Take the quizWhat Kind of Holiday Spender Are You? Take the Black Friday QuizStart →





 Lifestyle7 Signs Your Social Battery Is Running Low (and Why You Keep Cancelling Plans)
 Lifestyle · Food & HealthThanksgiving Food Safety: How Long Leftovers Last and the Safe Turkey Temperature
 Lifestyle7 Quiet Habits of Emotionally Intelligent People, According to Psychologists
 LifestylePeople Who Don’t Like Celebrating Their Birthday Often Share These 7 Traits