AMZN Stock Gains 20.60%, Testing Key Resistance In Focus
On Agustus 4, 2026: price 284.02 USD, trend sideways, RSI 67.7, support 226.65, resistance 271.58. technical analysis of amzn stock. AMZN Stock Gains — full…

Amazon.com Inc. jumped to 284.02 USD on NASDAQ, a sharp move that pushed the stock beyond its recent trading envelope and above the upper Bollinger Band, according to Yahoo Finance data for 31 July 2026 20:30 WIB. The move is not just about a higher print; it signals a market that has rushed ahead of the stock’s recent average price, while the technical backdrop now looks stretched and unusually crowded on the day.
Trend & Price Action
The first signal is simple: AMZN is trading above both the 20-day SMA at 243.86 and the 50-day SMA at 246.63. That matters because moving averages often act like a market’s memory of fair value. When price sits above them, the trend is usually constructive; when it sits far above them, the question becomes whether the move is being built on steady demand or a short burst of enthusiasm.
Here, the trend label still reads sideways, and the SMA20 slope is only 0.01% over 5 days, which tells us the longer pattern has not yet fully turned into a clean uptrend. In other words, the stock is no longer trading like it did earlier in the month, but the average line itself has not accelerated enough to confirm a durable breakout structure.
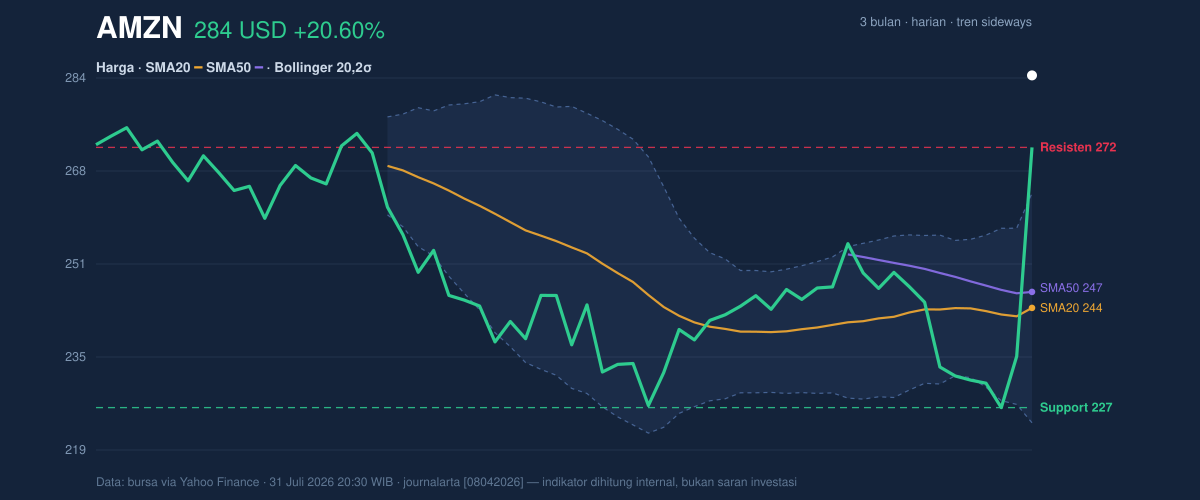
The price is also sitting above the 20-hour resistance at 271.58 and near the top of the recent range, with the 3-month high at 278.56 now already exceeded. That is a meaningful shift. A stock that clears a recent ceiling can attract momentum flows, but it also tends to invite profit-taking from traders who were waiting for exactly that level. The fact that the last price is at 128% of the 20-hour range underscores how extended the move is relative to the short-term structure.
Oscillators & Momentum
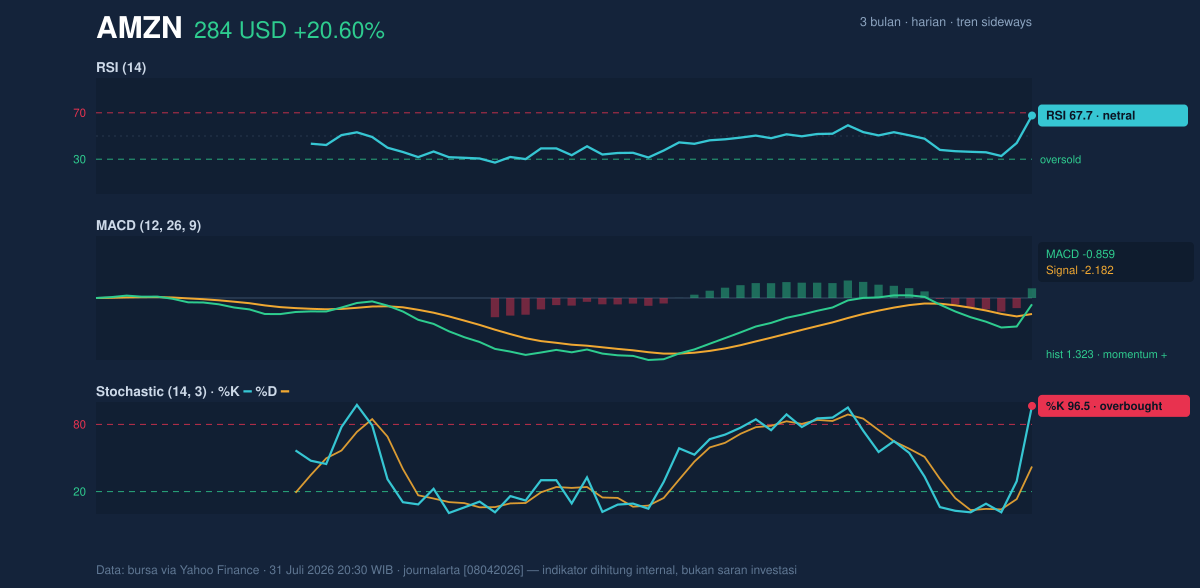
Momentum is mixed rather than cleanly bullish. The RSI at 67.7 sits in a neutral-to-strong zone, close to the overbought threshold but not yet screaming exhaustion. By contrast, the Stochastic %K at 96.5 versus %D at 42.4 is the more aggressive signal: it shows price has surged faster than the recent baseline, a classic overbought reading. In plain English, the stock has moved quickly enough that it may need to pause or retest before it can extend further.
The MACD at -0.859, above the signal line at -2.182, with a positive histogram of 1.323 is the most supportive momentum evidence in the set. MACD is still below zero, which means the broader medium-term trend is not fully rehabilitated, but the positive histogram shows the recent move has shifted momentum upward. That combination often appears during early-stage recoveries or sharp relief rallies: the stock is improving, but the structure is not yet fully confirmed.
Volatility & Volume
The Bollinger Band upper level at 263.69 has been overtaken, and the %B at 151% indicates the stock is trading well beyond the upper band. That is not a normal daily position; it usually means price has run ahead of its statistical range. The band width at 16.3% is described as normal, so this is not a squeeze breakout from a compressed volatility regime. Instead, it looks more like a sudden expansion layered on top of an already orderly band structure.
That distinction matters. A squeeze often suggests a move is being released from pressure; here, the market appears to have created its own pressure through an outsized session. The ATR(14) at 9.26, or 3.3% of price, confirms volatility is moderate rather than chaotic. So while the move is large in percentage terms, the market is not showing the kind of disorder that usually accompanies panic or capitulation.
Volume adds another layer. 129,054,800 shares traded versus a 20-hour average of 45,551,520, a 2.8× surge. That is real participation, not a thin print. But the OBV is down, which is the caution flag in the data. OBV, or on-balance volume, tracks whether volume is supporting higher prices over time. A falling OBV while price jumps can mean the rally is not yet broadly confirmed by accumulation; it may be driven by a concentrated burst of buying rather than sustained sponsorship.
Key Levels & Scenarios
The chart now places the key battlegrounds clearly: support at 226.65 and resistance at 271.58, with the stock currently above both. That means the old resistance has already been tested by price and failed to contain it. The next question is whether that breakout can hold on a closing basis, or whether the move fades back into the prior band.
If AMZN stays above 271.58, the market will likely treat the breakout as validated and focus on whether the price can remain above the recent high zone at 278.56. If it slips back below that former resistance, the move begins to look more like an overextended spike than a durable trend shift. On the downside, a fall back toward 243.86 would bring the 20-day average into play as the first major test of whether this rally has staying power.
The core signal is this: AMZN has broken out on heavy volume, but momentum is already overbought and volume confirmation is not fully aligned because OBV is still falling. That makes the move impressive, but not yet cleanly confirmed.
Technical Verdict: HOLD (wait & see)
HOLD (wait & see)
- MACD is positive and the histogram is constructive, showing improving momentum.
- Price is above SMA20, SMA50, and the 20-hour resistance, which supports the breakout case.
- Stochastic is overbought and %B is 151%, warning that the move is stretched and vulnerable to a pullback.
- Verdict invalidated if price falls below 243.86, where the 20-day SMA and Bollinger middle band sit.
- Ideal Entry Range: 243.86 to 271.58
- Exit Target: 278.56
- Stop Loss protection: 226.65
In plain English: the stock has moved strongly, but the technical picture says it is better to watch whether the breakout holds than to assume the surge will keep running.
Summary Data AMZN
| Last price | 284.02 USD |
| Change 1 day / 5 days / 1 month | 20.60% / 22.36% / 17.04% |
| Trend / MA-cross | sideways / none |
| SMA20 / SMA50 | 243.86 / 246.63 |
| RSI (14) / Stochastic %K | 67.7 / 96.5 |
| Bollinger %B / ATR | 151% / 9.26 |
| Support / Resistance 20 days | 226.65 / 271.58 |
| Data as of | 31 Juli 2026 20:30 WIB |
Track AMZN stock price daily: live levels, support/resistance and our full AMZN analysis history.


