MSFT Stock Gains 8.10% Today, RSI Overbought
On Agustus 4, 2026: price 487.65 USD, trend sideways, RSI 74.5, support 381.58, resistance 464.72. technical analysis of msft stock. MSFT Stock Gains — full…

Microsoft shares surged on the NASDAQ, with MSFT last changing hands at $487.65 after a 1-day gain of 8.10%, extending a run that has lifted the stock 27.76% in 5 days and 24.88% in 1 month. The move is not subtle. It has pushed the stock beyond the upper edge of its recent trading frame, and the chart now shows a market that is being driven more by momentum than by calm price discovery.
Trend & Price Action
The broader structure is still labeled sideways, but that description is starting to look outdated in the short term because the share price is now far above the moving averages. MSFT is trading above the SMA20 at $396.87 and the SMA50 at $399.40, which tells readers that the latest advance has moved well beyond the average price paid over the past month or two. That matters because moving averages often act like a memory of where buyers and sellers previously found balance; when price is far above them, the market is signaling urgency, and sometimes exhaustion.
The slope of the SMA20 at 2.58% over 5 days points upward, so the short-term trend is still improving rather than flattening. There is no fresh MA-cross, meaning the move has not been triggered by a new long-term average crossover event. In plain language, this is a momentum burst rather than a slow structural trend reversal.
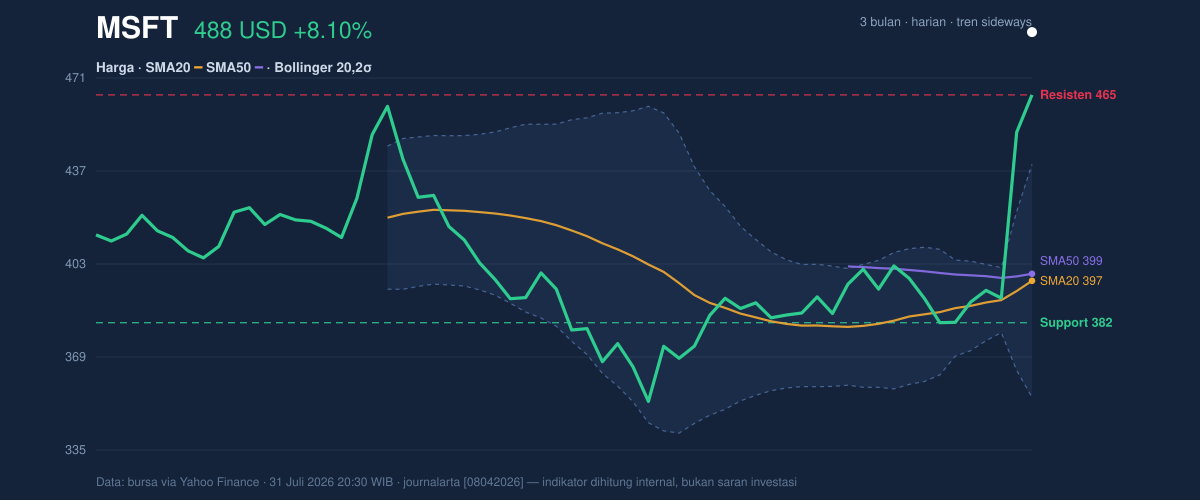
The price is also sitting at 128% of the 20-hour range, which is a strong sign of extension. It has already moved above the 20-hour resistance at $464.72 and is now trading above the 3-month high of $466.84. That is important because breakouts above prior highs can attract additional buying, but they also tend to invite profit-taking once the market realizes it has run ahead of itself.
Oscillators & Momentum
The momentum tools are aligned, but they are also flashing caution. RSI(14) at 74.5 is in overbought territory, which means recent gains have been strong enough to raise the risk of a pause or pullback. Stochastic %K at 97.6 and %D at 78.1 are even more stretched, reinforcing the idea that the stock has climbed quickly and may be vulnerable to cooling off.
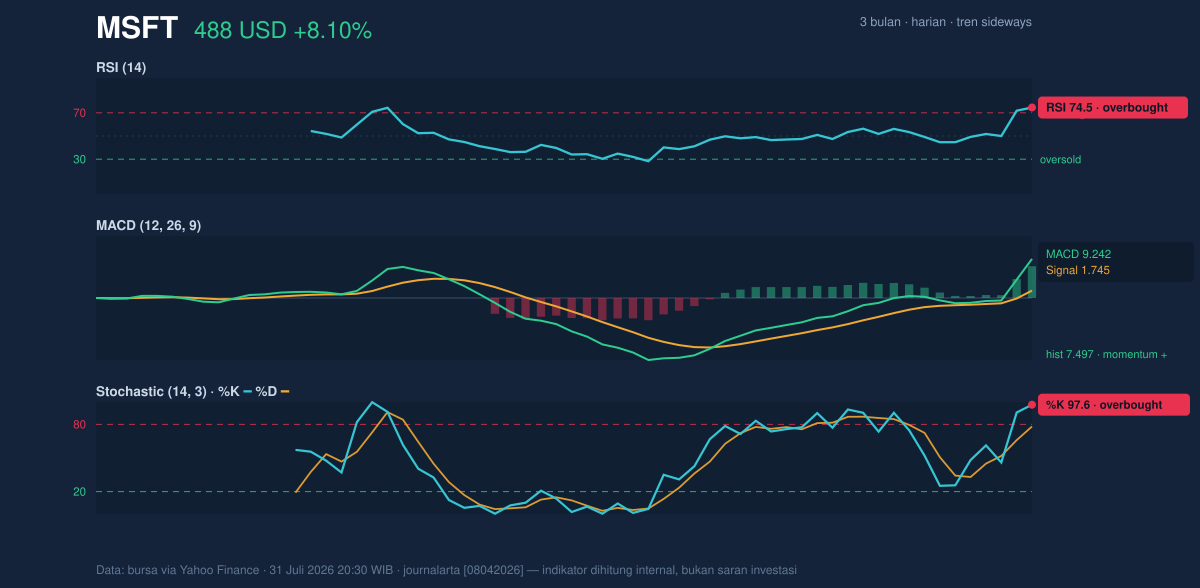
That said, overbought does not automatically mean reversal. In strong advances, oscillators can stay elevated for a while. The key confirmation is the MACD at 9.242 versus its signal line at 1.745, with a histogram of 7.497. This is a clear sign that upward momentum is still beating the trend’s internal average. Put simply: the stock is stretched, but the push higher is still real.
The signal mix matters. RSI and Stochastic are warning that the move is mature, while MACD says the trend has not yet broken. When those two readings disagree in this way, the market is often in a late-stage advance where price can keep rising, but each extra step becomes harder to sustain.
Volatility & Volume
Volatility is elevated, and the Bollinger setup confirms it. The Bollinger upper band at $439.40 has already been left behind, while %B at 157% shows the stock is trading well outside the normal band envelope. That usually means the move has entered an extreme zone. The bands are also wide at 21.4%, which signals a volatility expansion rather than a squeeze. In practical terms, the market is not coiling for a quiet move; it is already in a fast one.
ATR(14) at 16.44, or 3.4% of price, suggests daily movement remains meaningful but not chaotic. The more striking confirmation comes from volume: 60,846,000 shares changed hands versus a 20-hour average of 36,246,165, a 1.7× jump. That is the kind of participation that helps validate a breakout. Rising OBV, or on-balance volume, adds another layer of confirmation, showing that heavier trading has accompanied the climb rather than fading underneath it.
This is the central tension in the chart: strong participation supports the breakout, but the stock is now far above its normal volatility bands, which raises the odds of a sharp reaction if enthusiasm cools.
Key Levels & Scenarios
The most relevant near-term level is the 20-hour resistance at $464.72, which has already been exceeded. Below current levels, the first reference point is the 20-hour support at $381.58, with the SMA20 at $396.87 and SMA50 at $399.40 forming a second layer of support if the stock begins to retrace. The 3-month high at $466.84 is now more of a psychological marker than a ceiling, because price has pushed beyond it.
If MSFT can hold above the breakout zone, the chart suggests the market is trying to build a new price shelf above prior highs. If it slips back under the recent high area and loses momentum, the overbought oscillators and expanded Bollinger position argue for a faster-than-usual pullback toward the moving averages. That is what happens when a stock stretches too far too quickly: the first real test often comes not from bad news, but from simple exhaustion.
Technical Verdict: HOLD (wait & see)
Verdict: HOLD (wait & see)
- RSI at 74.5 and Stochastic at 97.6/78.1 show the stock is overbought, so upside may continue but is increasingly extended.
- MACD at 9.242 with a 7.497 histogram confirms positive momentum, and volume at 1.7× average supports the breakout.
- %B at 157% and the 21.4% Bollinger width indicate price is trading well outside its normal band, which often precedes either consolidation or a sharp reaction.
- Invalidation: this verdict is invalidated if price falls below $381.58.
- Ideal Entry Range: $399.40 to $396.87
- Exit Target: $464.72 to $466.84
- Stop Loss protection: below $381.58
In plain English: the stock is strong, but it has run hot enough that the next move may be a pause rather than another straight climb.
“Momentum is still in charge, but the chart is asking a harder question now: can Microsoft keep running after already outrunning its own averages?”
Summary Data MSFT
| Last price | 487.65 USD |
| Change 1 day / 5 days / 1 month | 8.10% / 27.76% / 24.88% |
| Trend / MA-cross | sideways / none |
| SMA20 / SMA50 | 396.87 / 399.40 |
| RSI (14) / Stochastic %K | 74.5 / 97.6 |
| Bollinger %B / ATR | 157% / 16.44 |
| Support / Resistance 20 days | 381.58 / 464.72 |
| Data as of | 31 Juli 2026 20:30 WIB |
Track MSFT stock price daily: live levels, support/resistance and our full MSFT analysis history.


