RSI Overbought, BAC Stock Gains 1.27% Today
On Agustus 13, 2026: price 64.81 USD, trend uptrend, RSI 74.0, support 60.42, resistance 64.81. technical analysis of bac stock. RSI Overbought — full details…

Bank of America is pressing against the top of its recent range, a sign that the market is still rewarding the stock’s trend, even as momentum has become stretched. The shares closed at 64.81 USD on the NYSE, up 1.27% from the prior close of 64.00, and the move leaves BAC just below its 3-month high of 64.95.
Trend & Price Action
The broader structure remains constructive. BAC is trading above both the SMA20 at 62.32 and the SMA50 at 59.16, which means short-term and medium-term buyers are still in control. The uptrend is reinforced by the SMA20 slope of 1.48% over 5 days, a useful sign that the average price itself is rising rather than merely being crossed by a one-day jump.
That matters because an uptrend with a rising short-term average is usually more durable than a simple spike. It suggests that recent buying has been persistent enough to pull the trend line higher, not just force a brief overshoot.
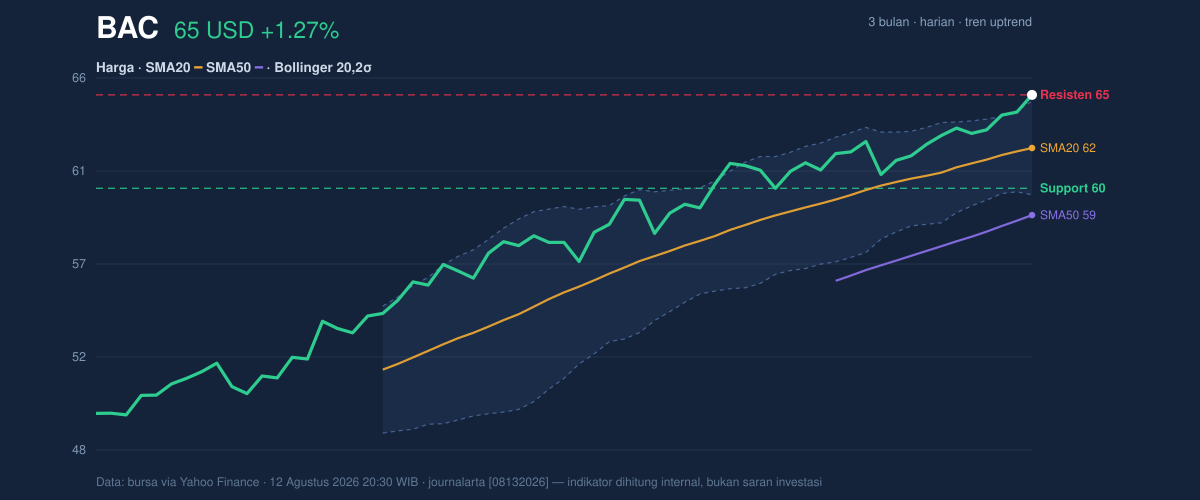
The chart also shows BAC sitting at the very top of its 20-hour support/resistance range, with support at 60.42 and resistance at 64.81. In practical terms, the stock is not just near resistance; it is at the ceiling of the measured range. That is often where markets either pause to digest gains or attempt a breakout into a new leg higher.
The Bollinger Bands add an important layer. Price is above the upper band at 64.52, with %B at 107%, which means BAC has pushed beyond the normal statistical envelope of the last 20 sessions. That does not automatically signal reversal, but it does say the stock is trading in an extended zone. Combined with the 7.1% band width, which is described as a squeeze, the message is sharper: volatility has been compressed, and the market may be preparing for a bigger directional move. When a stock is both stretched and squeezed, the next move can be energetic, but timing becomes less forgiving.
Oscillators & Momentum
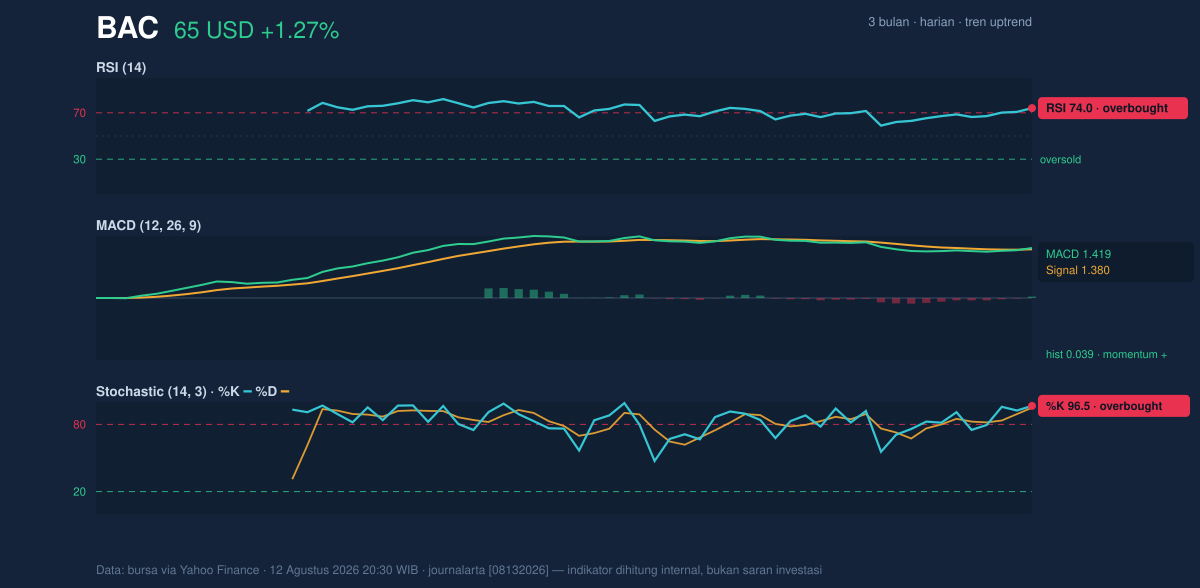
Momentum is positive, but it is also hot. The RSI at 74.0 is in overbought territory, and the Stochastic %K at 96.5 with %D at 94.9 says the same thing in even more forceful language: BAC has been closing near the top of its recent range for long enough that the short-term market is becoming crowded on the bullish side.
For general readers, “overbought” does not mean the stock must fall. It means the pace of the rise has been strong enough that the next move often becomes more two-sided, with traders more willing to take profits on strength. That can slow the advance, or it can simply lead to a brief consolidation before another attempt higher.
The MACD at 1.419, above its signal line at 1.380, still leans bullish. The histogram at 0.039 shows the gap is positive, but not wide. That is a subtle but important point: the trend is still confirmed, yet the momentum engine is not accelerating aggressively. In plain language, BAC is climbing, but not with the kind of expanding thrust that typically accompanies a clean breakout.
Volatility & Volume
Volatility appears contained for now. The ATR at 0.98, equal to 1.5% of price, indicates a moderate daily swing profile. That is enough movement to matter, but not enough to imply disorder. The setup is therefore less about panic and more about whether the current squeeze resolves into a directional expansion.
Volume was lighter than normal, with 27,517,600 shares traded versus a 20-hour average of 30,676,345, or 0.9x normal. That matters because breakouts usually look healthier when they are backed by participation. A move to a new high on softer volume can still work, but it often needs confirmation later. The encouraging counterweight is that OBV is rising, which means cumulative volume flow has continued to favor buyers even if the latest session was not especially heavy.
In other words, the market is still leaning bullish underneath the surface, but the latest push has not yet drawn the kind of broad participation that would make the move feel fully validated.
Key Levels & Scenarios
The immediate line in the sand is the 64.81 resistance area, which is also the current closing price. A clean hold above that level would keep BAC in breakout territory, especially with the 3-month high at 64.95 just ahead. If price clears that zone, the chart would shift from “testing resistance” to “discovering price,” a more open-ended phase where old ceilings stop mattering as much.
If the stock fails to sustain above the top of the range, the first area to watch is the SMA20 at 62.32, which also matches the Bollinger middle band. That level matters because it often acts as the market’s short-term balance point. A move back toward it would not break the trend, but it would signal that the latest extension is being unwound.
Below that, the 60.42 support becomes the key defense. A drop through it would suggest the squeeze resolved downward rather than upward, and that the recent strength was more of a temporary overshoot than a lasting base expansion.
Technical Verdict: HOLD (wait & see)
HOLD (wait & see) fits the chart best because the trend is still positive, but momentum is stretched and the stock is pressing against resistance.
- Reason 1: Price remains above the SMA20 at 62.32 and SMA50 at 59.16, so the trend is intact.
- Reason 2: RSI 74.0 and Stochastic 96.5/94.9 show overbought conditions, which raises the odds of pause or consolidation.
- Reason 3: MACD is positive and OBV is rising, so the underlying bias still favors buyers, but the %B at 107% and narrow 7.1% Bollinger width warn that the move is extended and could become volatile.
- Invalidation: this verdict is invalidated if price falls below 60.42, which would break the nearest support and weaken the current trend structure.
- Ideal Entry Range: 62.32 to 60.42
- Exit Target: 64.95 and, if that is cleared, the next move would be into fresh-high territory beyond the current range
- Stop Loss protection: below 60.11, the lower Bollinger band, or more conservatively beneath 60.42 support
For non-traders, this means BAC is still strong, but the stock is stretched enough that the market may want proof before extending the rally further.
Summary Data BAC
| Last price | 64.81 USD |
| Change 1 day / 5 days / 1 month | 1.27% / 2.47% / 5.23% |
| Trend / MA-cross | uptrend / none |
| SMA20 / SMA50 | 62.32 / 59.16 |
| RSI (14) / Stochastic %K | 74.0 / 96.5 |
| Bollinger %B / ATR | 107% / 0.98 |
| Support / Resistance 20 days | 60.42 / 64.81 |
| Data as of | 12 Agustus 2026 20:30 WIB |


