Golden Cross Formed, VZ Stock Gains 2.64% Today
On Agustus 14, 2026: price 48.22 USD, trend uptrend, RSI 63.7, support 43.50, resistance 48.22. technical analysis of vz stock. Golden Cross Formed — full…

Verizon Communications Inc. rose to 48.22 USD on the NYSE on 13 August 2026, up 2.64% from the previous close of 46.98, as the stock pushed back toward the top of its recent range. The move matters because it did not happen in isolation: price is now above its short- and medium-term averages, momentum remains positive, and the chart is pressing against a known ceiling rather than drifting in the middle of nowhere.
Trend & Price Action
The most important signal is that Verizon is still trading in an uptrend, with the SMA20 at 46.26 above the SMA50 at 45.30, forming a golden cross. That crossover is a simple but powerful sign that near-term buying pressure has overtaken the slower trend. In plain English, the stock is no longer just bouncing; it is being carried by a trend that has improved enough to pull the short average above the longer one.
The slope of the SMA20, up 2.50% over 5 days, reinforces that message. As shown in the chart, price is also sitting above the middle Bollinger band, which is the same 20-day average at 46.26. That placement tells readers the stock is trading with the prevailing trend, not fighting it.
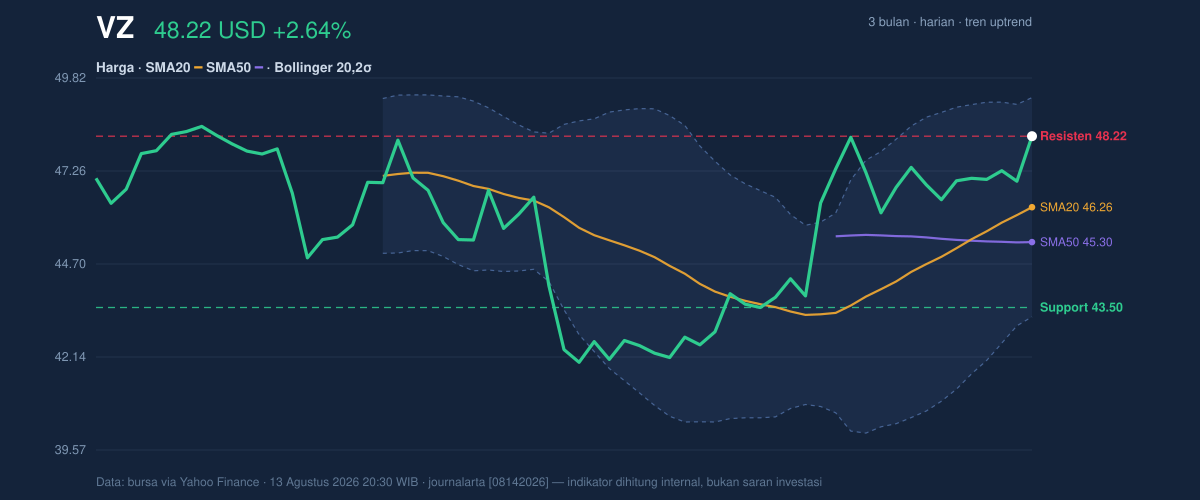
At the same time, the stock is now at the top of the 20-hour range, with support at 43.50 and resistance at 48.22. That means the latest print is not far from a short-term decision point: either buyers have enough force to keep the move alive, or the stock pauses after reaching the upper edge of its recent corridor. The broader context is constructive too, because the share price is only a step below the 3-month high of 49.01 and well above the 3-month low of 40.76.
Oscillators & Momentum
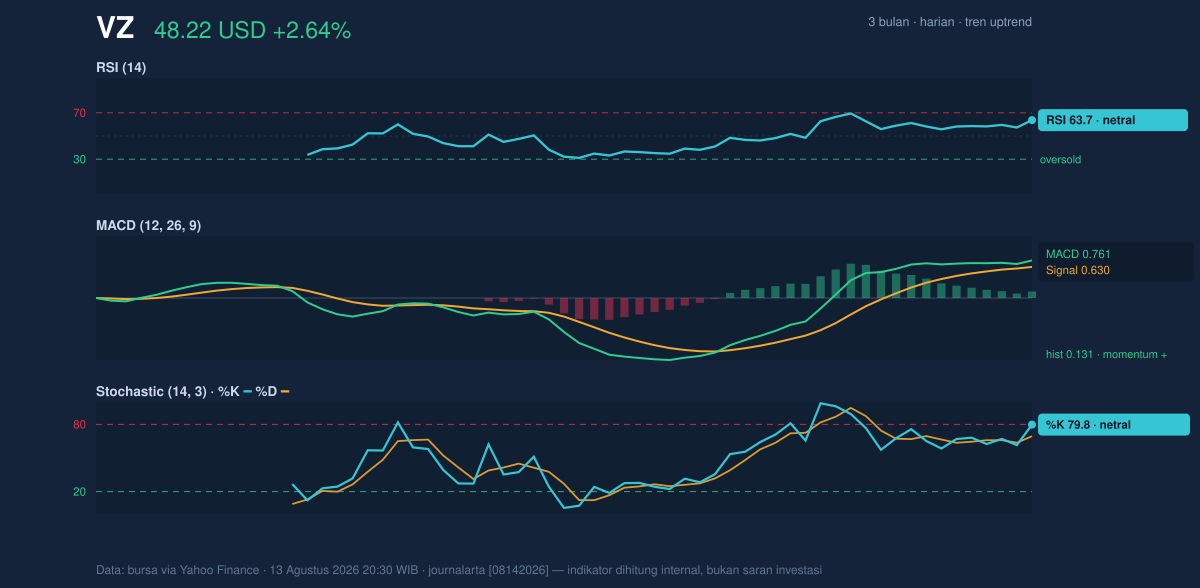
Momentum is positive, but not stretched into a dramatic overbought condition. The RSI at 63.7 is described as neutral, which usually means the stock has room to continue moving without immediately flashing a warning. RSI is not a forecast by itself; it is a gauge of how forceful recent gains have been. At this level, it suggests demand is healthy, but not yet extreme.
The Stochastic %K at 79.8 and %D at 69.5 are also neutral, though the faster line is close to the upper end of its range. That matters because stochastic often reacts faster than RSI; near 80, it can hint that short-term enthusiasm is becoming more fully priced in, even if the broader trend still points higher. The key point is alignment: momentum tools are not fighting the trend, they are broadly confirming it.
The strongest confirmation comes from MACD at 0.761, above its signal line at 0.630, with a histogram of 0.131. That spread says bullish momentum is still active. In practical terms, the shorter-term trend is moving faster than the longer-term trend, which is what analysts want to see when a stock is trying to hold a breakout or extend an advance.
Volatility & Volume
Bollinger Bands show the stock is pressing toward the upper boundary, with the upper band at 49.28 and %B at 82%. %B measures where price sits inside the band structure, and 82% means Verizon is relatively high in its recent trading envelope. That is not a sell signal on its own, but it does tell readers the stock is no longer cheap relative to its own recent history. The 13.1% band width is normal, not squeezed, so the chart is not coiled for an explosive move simply because volatility has collapsed. Instead, the setup suggests a steady trend with room for a test of resistance.
Volatility is also moderate by ATR. The ATR(14) of 1.31, equal to 2.7% of price, implies the stock can still move meaningfully in either direction without being erratic. That is useful for reading the chart: a one-day pullback would not necessarily damage the trend, but a sharper drop through support would carry more weight.
Volume, however, adds a note of caution. The latest 17,931,600 shares traded are below the 20-hour average of 25,296,885, or about 0.7x normal. That means the rally is not being backed by heavy participation. Price can rise on lighter volume, but the move is usually more convincing when more investors are involved. The encouraging counterpoint is that OBV is rising, which suggests accumulated buying pressure has been building even if the latest session was not especially busy.
Key Levels & Scenarios
The immediate technical battleground is clear. 48.22 is both the latest price and the current 20-hour resistance marker, so the stock is already testing the upper edge of its short-term structure. Above that, the next visible reference is the 3-month high at 49.01, followed by the Bollinger upper band at 49.28. That cluster forms a narrow overhead zone where traders will likely watch for hesitation.
On the downside, 46.26 is the first important pivot because it is the SMA20 and the Bollinger middle band. If price slips back below that level, the recent burst loses some of its trend support. A deeper fade toward 45.30 would bring the SMA50 into focus, and a break under 43.50 would weaken the current structure much more decisively.
Technical Verdict: HOLD (wait & see)
HOLD (wait & see) fits best because the trend is constructive, but price is already near resistance and volume has not fully confirmed the push.
- MACD remains positive, so momentum still favors the upside.
- Golden cross and rising SMA20 show the trend has improved and is holding.
- %B at 82% and price at 48.22 mean the stock is pressing against the upper end of its recent band, where pauses are common.
Verdict invalidated if price falls below 43.50, because that would break the near-term support line and weaken the current uptrend.
- Ideal Entry Range: 46.26 to 45.30
- Exit Target: 49.01 to 49.28
- Stop Loss Protection: below 43.50
For non-traders: Verizon looks technically firm, but it is already near a ceiling, so the chart is asking for confirmation before the next move. “This is a good place to be careful, because the stock is strong, but it is also close to the point where strength has to prove itself.”
Summary Data VZ
| Last price | 48.22 USD |
| Change 1 day / 5 days / 1 month | 2.64% / 2.62% / 9.89% |
| Trend / MA-cross | uptrend / golden |
| SMA20 / SMA50 | 46.26 / 45.30 |
| RSI (14) / Stochastic %K | 63.7 / 79.8 |
| Bollinger %B / ATR | 82% / 1.31 |
| Support / Resistance 20 days | 43.50 / 48.22 |
| Data as of | 13 Agustus 2026 20:30 WIB |



