Momentum Gains, AMD Stock Gains 6.50% Today
On Agustus 17, 2026: price 514.39 USD, trend sideways, RSI 53.8, support 429.56, resistance 552.33. technical analysis of amd stock. Momentum Gains — full…

International investors are watching AMD as the chipmaker trades higher inside a still-uncertain range, with the latest move showing strength but not yet a full trend change.
Advanced Micro Devices closed at 514.39 USD on NASDAQ, up 6.50% from the previous close of 483.01, according to exchange-linked market data cited via Yahoo Finance. That jump matters because it pushes the stock back above its SMA20 at 494.24, a short-term average that often acts like a line between routine trading and a more convincing recovery. Yet the broader picture is less clean: AMD remains in a sideways trend, and the SMA20 is still sloping down by 1.83% over 5 days, which says recent buyers have improved the tape, but have not fully reversed the underlying drift.
Trend & Price Action
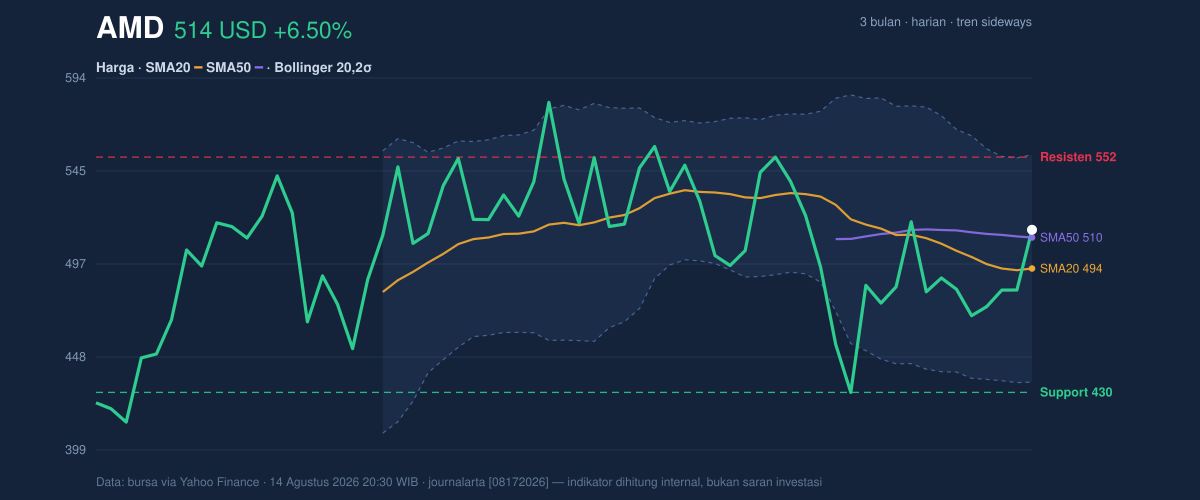
The stock is trading above the SMA20 and just below the SMA50 at 510.40, which places it in a technically interesting zone. In plain language, AMD has recovered enough to retake short-term footing, but it is still brushing against a medium-term barrier that can attract sellers. There is no fresh MA-cross, so the chart does not yet show the kind of moving-average crossover that would usually confirm a stronger trend shift.
The broader range also frames the move. AMD sits well above the 3-month low of 393.36, but still below the 3-month high of 584.73. The stock is currently at about 69% of its 20-hour range, which means the market has already priced in a decent rebound from the lower part of the band, but not a breakout through the ceiling. That positioning is important: it signals that sentiment has improved, but the market is still waiting for proof that the rally can extend rather than fade.
Oscillators & Momentum
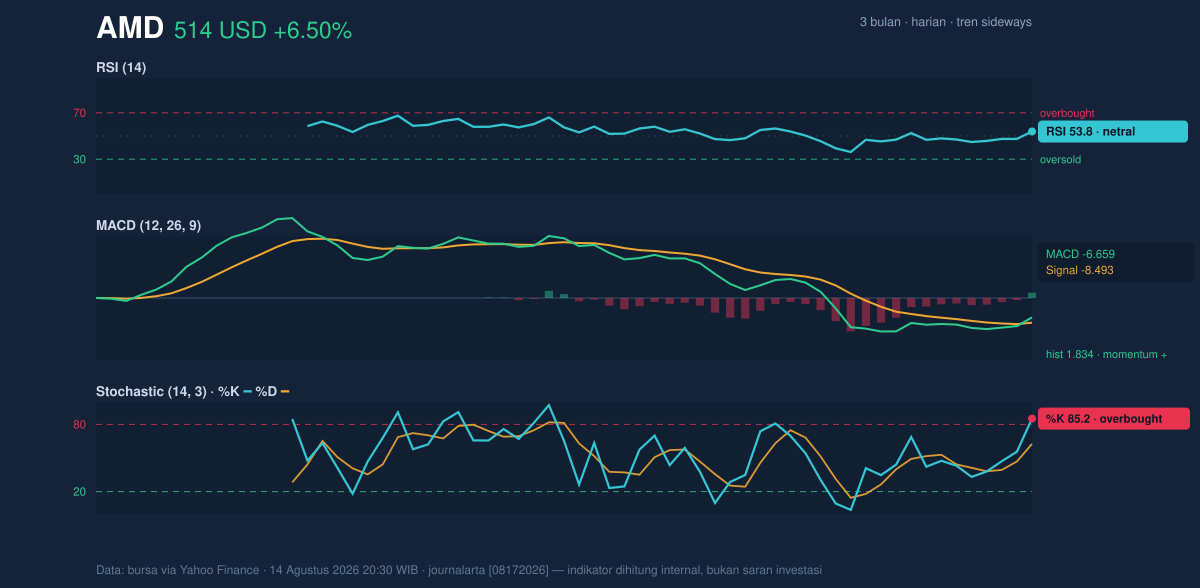
Momentum indicators are mixed, and that mix is the story. The RSI at 53.8 is neutral, which usually means the stock is neither stretched nor washed out. That is a healthy reading after a rebound, because it suggests there is still room for movement before momentum becomes extreme. By contrast, the Stochastic %K at 85.2 versus %D at 62.6 is in overbought territory. In simple terms, the recent rise has been fast enough that short-term traders may already be crowded into the trade, making the stock more vulnerable to pauses or pullbacks.
The MACD at -6.659, with a signal line at -8.493 and a positive histogram of 1.834, is more constructive. MACD is still below zero, so the broader momentum backdrop is not fully bullish, but the positive histogram shows the gap is narrowing in AMD’s favor. That usually means downward pressure is easing and the stock is attempting to build a base. In other words, momentum is improving faster than the trend itself, which is often what happens before a more durable turn — or before a failed rebound if price cannot clear resistance.
Volatility & Volume
The volatility setup is unusually important here. AMD’s Bollinger Bands are widening, with the upper band at 553.59, the middle band at 494.24, and the lower band at 434.88. A wider band usually means the market expects larger swings, not quiet consolidation. The %B at 67% shows price is above the middle of the band but not pressing the upper edge yet, which fits a stock that is recovering without being fully extended.
That is reinforced by the ATR(14) at 32.78, or 6.4% of price. ATR measures the average daily range, so this reading tells readers the stock can move sharply in either direction in a single session. The message is not just “high volatility”; it is that any break of support or resistance could travel farther than usual before the market finds its next balance.
Volume, however, adds a note of caution. Last trade volume was 25,481,000, below the 20-hour average of 28,498,520, or 0.9x normal. That means the latest rise did not come with full participation. Meanwhile, OBV is rising, which is a constructive divergence: on-balance volume tracks whether volume is accumulating or fading over time, and a rising OBV implies buyers have been quietly supporting the move even if the most recent session was not especially heavy. The combination suggests underlying demand is present, but confirmation is still incomplete.
Key Levels & Scenarios
The chart shows clearly defined boundaries. Immediate support sits at 429.56, while immediate resistance is 552.33. Those levels matter because they define the current battle between buyers and sellers. If AMD can push through the resistance zone and hold above it, the market would be signaling that the rebound has moved from recovery mode into breakout mode. If it fails to do so, the stock may remain trapped in the sideways structure and drift back toward the middle of the Bollinger band at 494.24, or lower if selling pressure returns.
A useful read here is that AMD has already reclaimed the lower half of the recent range, but it has not yet proven it can absorb supply near the upper boundary. The fact that price is above the SMA20 but below the SMA50 makes this a classic decision zone, not a finished trend.
Technical Verdict: HOLD (wait & see)
HOLD (wait & see)
- RSI at 53.8 is neutral, so momentum is not weak, but it is not strong enough to confirm a clean trend.
- Stochastic at 85.2/62.6 is overbought, which raises the risk of a short-term pause after the recent jump.
- MACD histogram at 1.834 is positive, but MACD remains below zero, so the recovery is improving rather than fully established.
- Verdict invalidated if price falls below 429.56, the listed support level.
- Ideal Entry Range: 494.24 to 510.40
- Exit Target: 552.33
- Stop Loss protection: 429.56
In plain English, AMD looks stronger than it did a few sessions ago, but the chart still needs to prove that this rebound can survive the next test at resistance.
“The next move matters more than the last one.”
Summary Data AMD
| Last price | 514.39 USD |
| Change 1 day / 5 days / 1 month | 6.50% / 6.42% / 3.76% |
| Trend / MA-cross | sideways / none |
| SMA20 / SMA50 | 494.24 / 510.40 |
| RSI (14) / Stochastic %K | 53.8 / 85.2 |
| Bollinger %B / ATR | 67% / 32.78 |
| Support / Resistance 20 days | 429.56 / 552.33 |
| Data as of | 14 Agustus 2026 20:30 WIB |


