PDD Stock Analysis: Gains 0.74%, Momentum Weakens
On Agustus 17, 2026: price 84.79 USD, trend sideways, RSI 43.8, support 82.66, resistance 93.00. technical analysis of pdd stock. PDD Stock Analysis — full…

PDD Holdings is still trading, but the tape is telling a more cautious story: the stock is up on the day, yet it remains pinned below its short-term trend line and near the lower part of its recent range. As shown in the chart, that mix matters because it suggests buyers are present, but not yet strong enough to reclaim control.
PDD closed at 84.79 USD, up 0.74% from the previous close of 84.17. That is a modest recovery, not a trend reversal. The bigger signal sits in the recent path: the shares are down 7.60% over five days, while the one-month change is only 0.77%, which points to a stock that has been chopping sideways rather than building a clean uptrend or downtrend. For international readers, this is the difference between a market that is merely pausing and one that is actually turning.
Trend & Price Action
The price is currently below the SMA20 at 87.58 but above the SMA50 at 84.03, a position that usually signals a market caught between short-term weakness and medium-term stability. In plain terms, the stock has not broken its broader base, but it also has not regained enough momentum to clear the nearer-term ceiling. The trend is labeled sideways, and the SMA20 slope of 0.95% over five days supports that reading: the moving average is rising, but only gently, which is more consistent with consolidation than with a breakout.
There is also no new MA-cross, meaning the faster average has not delivered a fresh bullish or bearish signal against the slower one. That absence matters. It tells traders the market has not yet committed to a new direction, even after recent volatility.
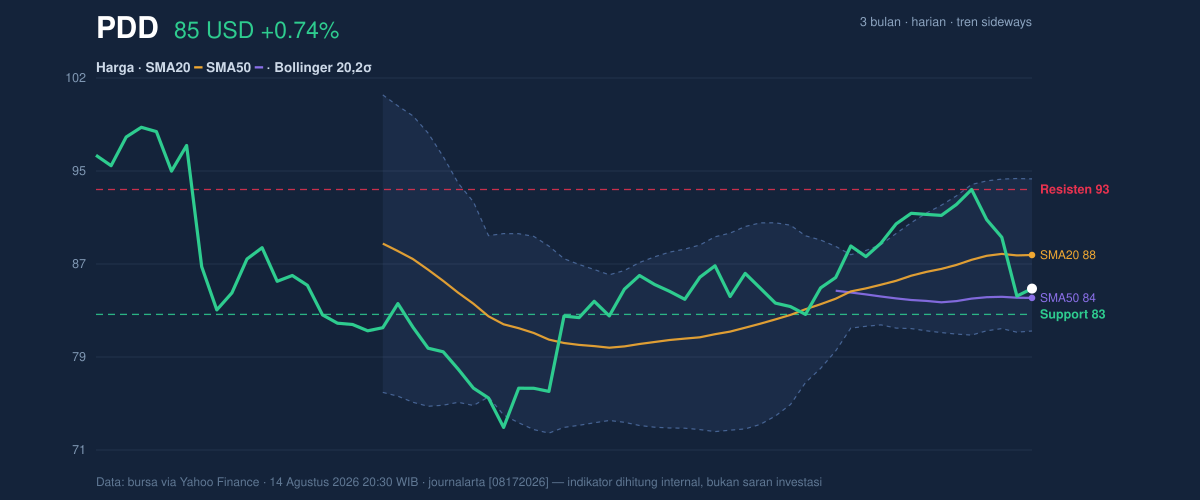
The stock is trading at about 21% of the way through its 20-day range, based on support at 82.66 and resistance at 93.00. That places PDD closer to support than resistance, which can be constructive if buyers defend the lower band. But it also means the recent bounce still has a long way to go before it can be called a recovery.
Oscillators & Momentum
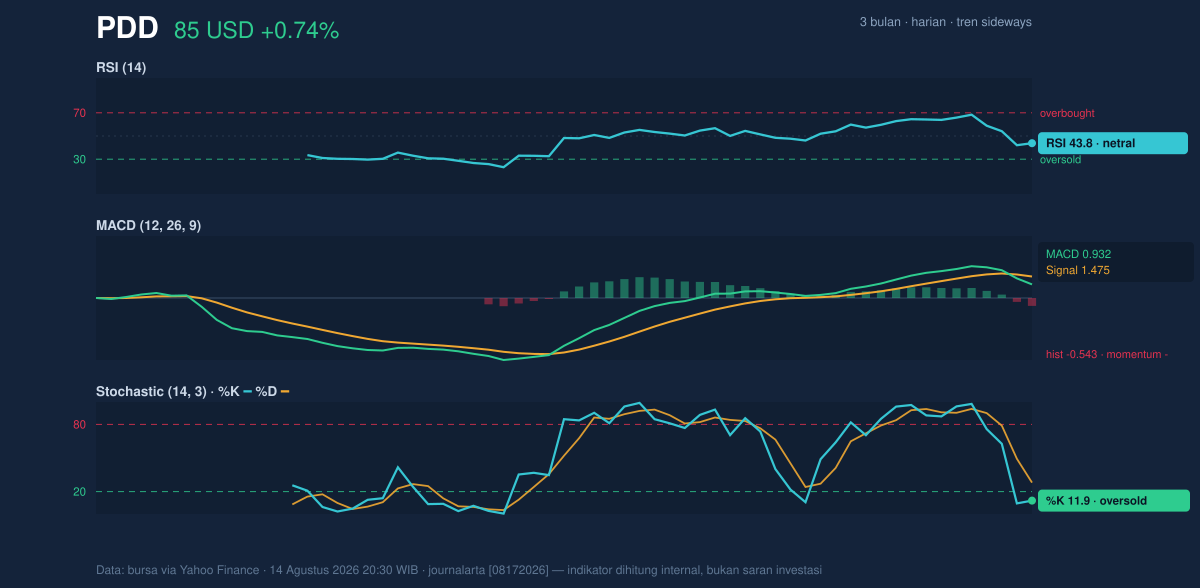
Momentum indicators are mixed, and that combination is often more useful than a single headline number. The RSI at 43.8 is neutral, which means the stock is neither overbought nor oversold on a broad momentum basis. That is important because neutral RSI often appears when a stock is waiting for a catalyst rather than already stretched in one direction.
The more interesting signal comes from the Stochastic %K at 11.9 and %D at 28.0. Stochastic is in oversold territory, which suggests the recent selloff has pushed short-term momentum to an extreme. In practice, that can mean downside pressure is becoming tired, but oversold does not automatically mean a rebound is imminent. It only says the stock is vulnerable to a bounce if buyers step in.
The MACD at 0.932 sits below the signal line at 1.475, with a histogram of -0.543. That is the clearest momentum warning in the data. MACD is a trend-following indicator, and when it sits below its signal line, it implies the recent price path is still weaker than the longer baseline. Put simply, the stock may be oversold in the short run, but the broader momentum has not yet turned positive.
Volatility & Volume
The Bollinger Band structure gives the chart more texture. Price is near the lower half of the band, with %B at 28%; that means the stock is trading closer to the lower band at 81.28 than the upper band at 93.87. The band width of 14.4% is described as normal, so this is not a squeeze that typically precedes a sharp compression breakout. Instead, the market appears to be moving within a routine volatility envelope, with room to swing either way.
ATR(14) is 2.35, or 2.8% of price, which indicates moderate volatility. That matters because moves around support or resistance can still be meaningful without being disorderly. In other words, the stock is active enough for a decisive test, but not so wild that every move should be dismissed as noise.
Volume, however, is not confirming strength. Last volume was 4,725,900, below the 20-day average of 5,616,705, or about 0.8× normal. Lower-than-average turnover on a rebound often suggests hesitation rather than conviction. The OBV is falling, which is especially notable: on-balance volume tracks whether money is generally flowing into or out of the stock, and a declining OBV says distribution is still outweighing accumulation.
Key Levels & Scenarios
The market’s immediate map is straightforward. 82.66 is the nearest support, and 93.00 is the nearest resistance. The broader 3-month range runs from 71.94 to 98.40, which frames the current price as mid-range rather than deeply depressed or near a major breakout zone.
If 82.66 holds, the oversold stochastic reading could help stabilize price action and allow a move back toward the middle Bollinger band at 87.58. If that middle band is reclaimed, the next test would naturally be the 93.00 resistance area. If price fails to defend 82.66, then the chart opens toward the lower Bollinger band at 81.28, with the 3-month low at 71.94 becoming the deeper reference point.
Technical Verdict: HOLD (wait & see)
HOLD (wait & see)
- Price is below the SMA20 at 87.58, so the short-term trend has not been reclaimed.
- MACD remains below its signal line, showing momentum is still negative.
- Stochastic is oversold, which argues for caution against chasing weakness, but not yet for declaring a durable reversal.
Verdict invalidated if price falls below 82.66, because that would break the nearest support and weaken the current consolidation structure.
- Ideal Entry Range: 82.66 to 84.03
- Exit Target: 87.58 to 93.00
- Stop Loss protection: below 81.28
For non-traders, this means the stock is not broken, but it has not yet proven that the recent weakness is over.
“It is still a market asking for confirmation, not giving it.”
Summary Data PDD
| Last price | 84.79 USD |
| Change 1 day / 5 days / 1 month | 0.74% / -7.60% / 0.77% |
| Trend / MA-cross | sideways / none |
| SMA20 / SMA50 | 87.58 / 84.03 |
| RSI (14) / Stochastic %K | 43.8 / 11.9 |
| Bollinger %B / ATR | 28% / 2.35 |
| Support / Resistance 20 days | 82.66 / 93.00 |
| Data as of | 14 Agustus 2026 20:30 WIB |


