Testing Key Resistance, T Stock Gains 1.26% Today
On Agustus 17, 2026: price 24.89 USD, trend uptrend, RSI 65.9, support 21.95, resistance 24.89. technical analysis of t stock. Testing Key Resistance — full…

AT&T closed at 24.89 USD, up 1.26% on the day and 14.12% over the past month, a move that leaves the stock pressing against the top of its recent range, according to data from Yahoo Finance at 14 August 2026, 20:30 WIB. That matters because the share price is no longer merely recovering; it is now testing whether the latest advance has enough sponsorship to turn into a more durable trend.
Trend & Price Action
The larger message from the chart is straightforward: AT&T remains in an uptrend, with the SMA20 at 23.68 sitting above the SMA50 at 22.68. That alignment signals that shorter-term trading has already outrun the medium-term average, which is usually what an improving tape looks like before it either consolidates or extends further. There is no fresh MA-cross, so the move is not being driven by a new moving-average breakout event; instead, it is being carried by price staying above the shorter average.
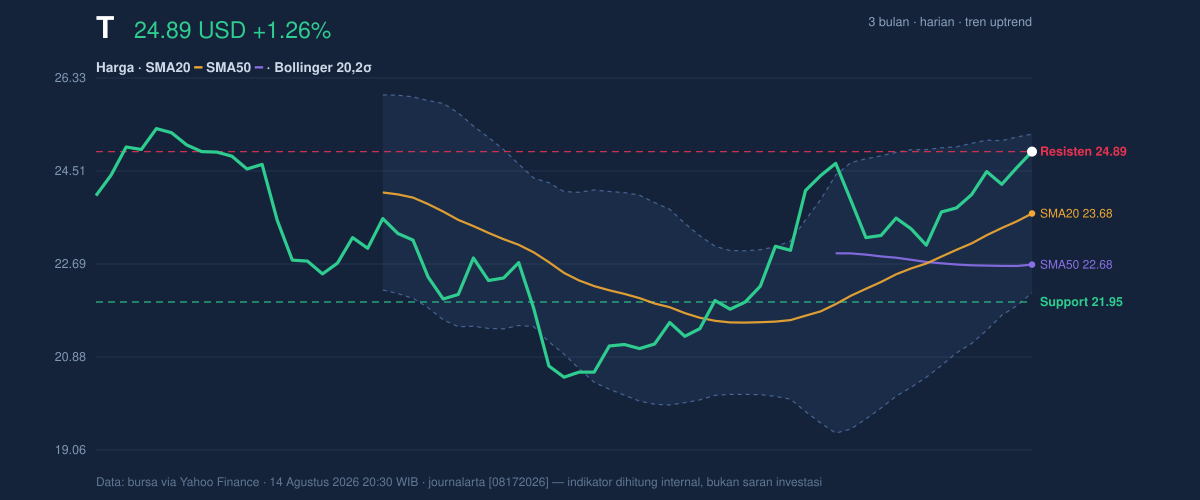
The stock is also trading right at the top of its near-term band: the 20-hour resistance at 24.89 is effectively where the last print landed, while the 20-hour support at 21.95 marks the lower edge of the recent range. In plain terms, the market has already done the hard part of climbing; the next question is whether it can hold that altitude. The 3-month high of 25.43 is now the next obvious ceiling, and the 3-month low of 19.89 shows how far the share price has moved away from its earlier stress point.
The Bollinger setup reinforces that idea. Price is sitting near the upper band, with %B at 89%, meaning the stock is trading close to the top of its volatility envelope. That is a sign of strength, but also a sign that upside is becoming more stretched in the short run. The Bollinger band width of 13.1% is normal rather than compressed, so this is not a quiet coiling pattern waiting for a big breakout; it is already an active move that may need a pause before it can continue.
Oscillators & Momentum
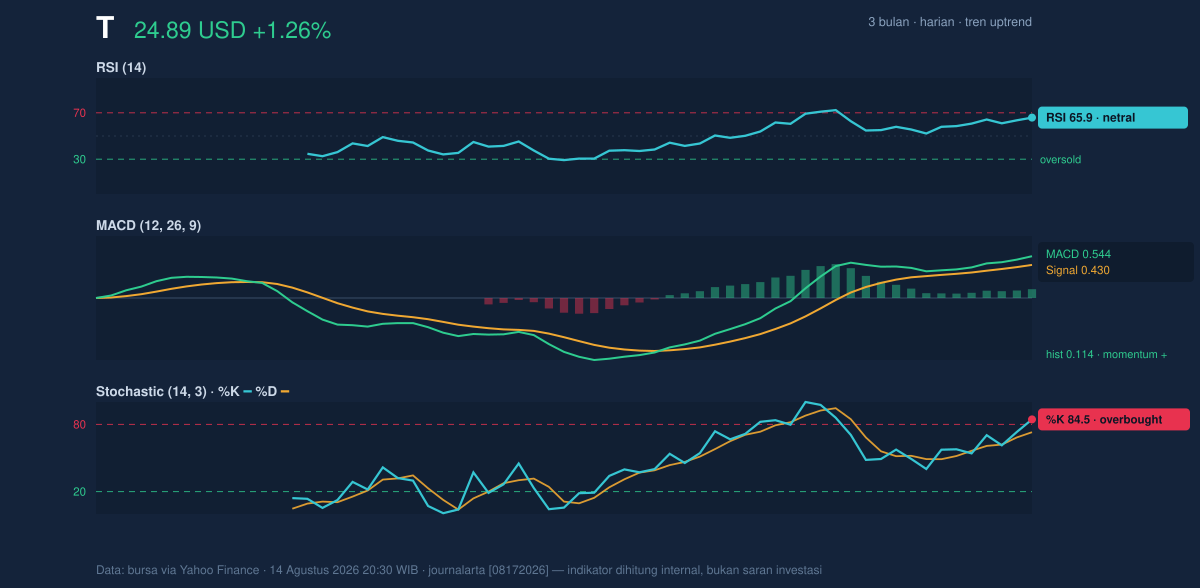
Momentum is supportive, but not fully relaxed. The RSI at 65.9 sits in neutral territory, which means the stock is not yet at a classic overbought extreme, even though it is getting close to one. That matters because RSI near 70 often tells traders that enthusiasm is becoming crowded; here, the reading says the trend still has room, but not much comfort.
The Stochastic %K at 84.5 and %D at 73.0 are more stretched. Stochastic measures where price sits within its recent range, so readings above 80 usually mean the stock is trading near the upper end of that range. In other words, the market has been strong enough to keep closing near the highs, but it is also vulnerable to a brief cooling-off period if buyers hesitate. The MACD at 0.544, above its signal line at 0.430, with a positive histogram of 0.114, shows that upward momentum is still intact. MACD is the clearest confirmation here: the trend is not just rising, it is rising faster than its own recent average.
That combination — RSI still manageable, Stochastic stretched, MACD positive — usually describes a stock that is strong but somewhat extended. It is the technical equivalent of a runner still moving well, though no longer fresh.
Volatility & Volume
Volatility is present, but not disruptive. The ATR at 0.63, or 2.5% of price, suggests a moderate daily swing range. That is important because it frames how much noise traders should expect around the current level: AT&T is not behaving like a high-beta momentum name, but it is moving enough that small pullbacks would be normal rather than alarming.
The volume picture is more nuanced. Last volume was 27,103,200, well below the 20-hour average of 67,393,730, or about 0.4x average. Thin volume during an advance can mean the move is not yet broadly confirmed by the market. In simple terms, fewer shares changing hands can make a rally easier to push, but also easier to fade if larger investors do not join in. The one offset is that OBV is rising, which implies that, over time, volume flow has still been net supportive. So while the latest session was quiet, the broader participation trend has not broken down.
Key Levels & Scenarios
The immediate battle is between the current price and the upper end of the recent range. A clean move through 24.89 would leave the market confronting the 3-month high at 25.43. If that level gives way, the chart would be signaling that the latest rally is no longer just a rebound but a continuation into fresh highs for the period. If price fails to hold the 23.68 SMA20, the tone would change from trend extension to trend defense, because that average is now the first line separating momentum from fatigue.
The broader support structure is anchored by 21.95. A decline back toward that zone would not automatically damage the longer pattern, but it would tell investors that the current advance has lost traction and is reverting toward the lower half of its recent range. The fact that price is already at the top of the range means the risk/reward balance is less forgiving here than it was a few sessions ago.
Technical Verdict: HOLD (wait & see)
HOLD (wait & see)
- MACD is positive and above its signal line, which supports the underlying uptrend.
- Stochastic is overbought and price is pressing the upper Bollinger band, suggesting the rally is extended in the short term.
- Volume is below average, so the latest push has not yet shown broad participation.
Verdict invalidated if price falls below 23.68, the SMA20, because that would weaken the immediate trend structure.
- Ideal Entry Range: 23.68 to 24.00, near the SMA20 and just below the current upper-band stretch.
- Exit Target: 25.23 to 25.43, using the upper Bollinger band and the 3-month high as reference points.
- Stop Loss protection: 22.13, the lower Bollinger band, with deeper chart risk toward 21.95 support.
For non-traders, this means the stock is still moving upward, but it is already close to where short-term gains often pause.
“The market is still saying yes, but it is no longer saying it loudly.”
Summary Data T
| Last price | 24.89 USD |
| Change 1 day / 5 days / 1 month | 1.26% / 4.62% / 14.12% |
| Trend / MA-cross | uptrend / none |
| SMA20 / SMA50 | 23.68 / 22.68 |
| RSI (14) / Stochastic %K | 65.9 / 84.5 |
| Bollinger %B / ATR | 89% / 0.63 |
| Support / Resistance 20 days | 21.95 / 24.89 |
| Data as of | 14 Agustus 2026 20:30 WIB |


