UNH Momentum Gains: Stock Gains 0.33% (September 29, 2026)
On September 29, 2026: price 377.83 USD, trend downtrend, RSI 41.3, support 371.29, resistance 400.94. technical analysis of unh stock.

UnitedHealth Group’s shares rose to 377.83 on the NYSE, but the move still leaves the stock below its short-term trend line and inside a broader corrective phase. The tape is not showing panic. It is showing hesitation.
Trend & Price Action
As shown in the chart, UNH is trading below its SMA20 at 384.14 and well under its SMA50 at 398.41, which keeps the stock in a downtrend despite the day’s modest gain. The slope of the SMA20, at -1.42% over 5 days, signals that the recent bounce has not yet changed the direction of travel. In plain terms, the stock is still moving under its own weight.
The price is also sitting in the lower part of its recent range: at 22% of the 20-day range, UNH is closer to support than resistance. That positioning matters because it suggests the market is still testing whether this is a base or just a pause in a larger slide. The 3-month high of 461.62 and 3-month low of 366.00 frame the current move as a recovery attempt that has not yet fully stabilised.
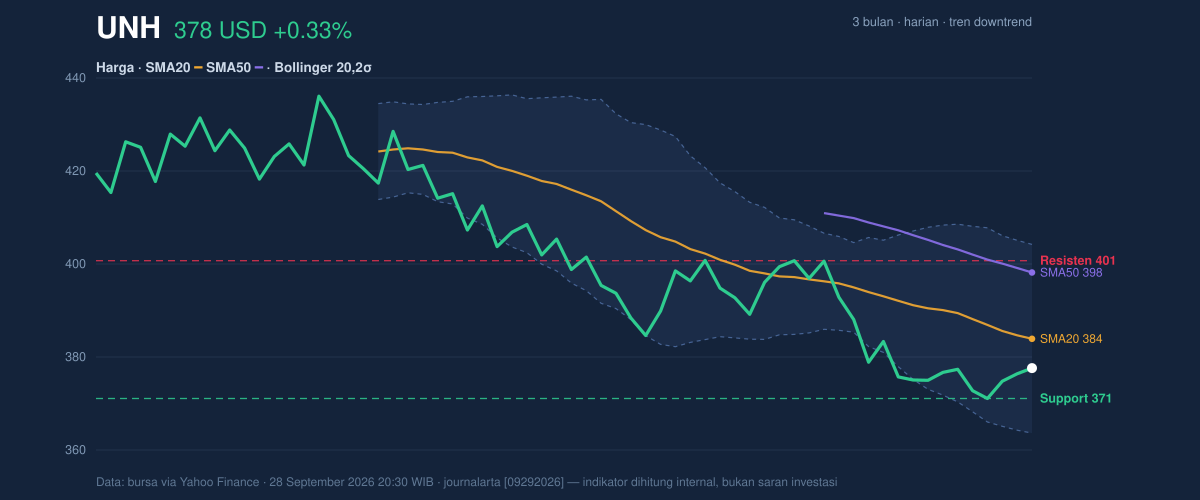
The Bollinger setup reinforces that view. With the middle band at 384.14 and the lower band at 363.84, price is trading below the mid-band but still above the lower band, which usually means the stock is weak without being technically broken. The 10.6% band width is normal, not compressed, so this is not a classic “coiled spring” setup. Instead, it points to room for movement without the market signaling a sharp volatility breakout yet.
Oscillators & Momentum
The momentum picture is more constructive than the trend picture. The RSI at 41.3 is neutral, but it sits below the midpoint that often separates firm momentum from soft momentum. That means sellers still have the upper hand, even if they are no longer in full control. The Stochastic %K at 29.2 and %D at 25.8 are also neutral, hovering near the lower end of the range without entering a deeply oversold zone. As shown in the chart, that combination usually describes a market that is weak, but not exhausted.
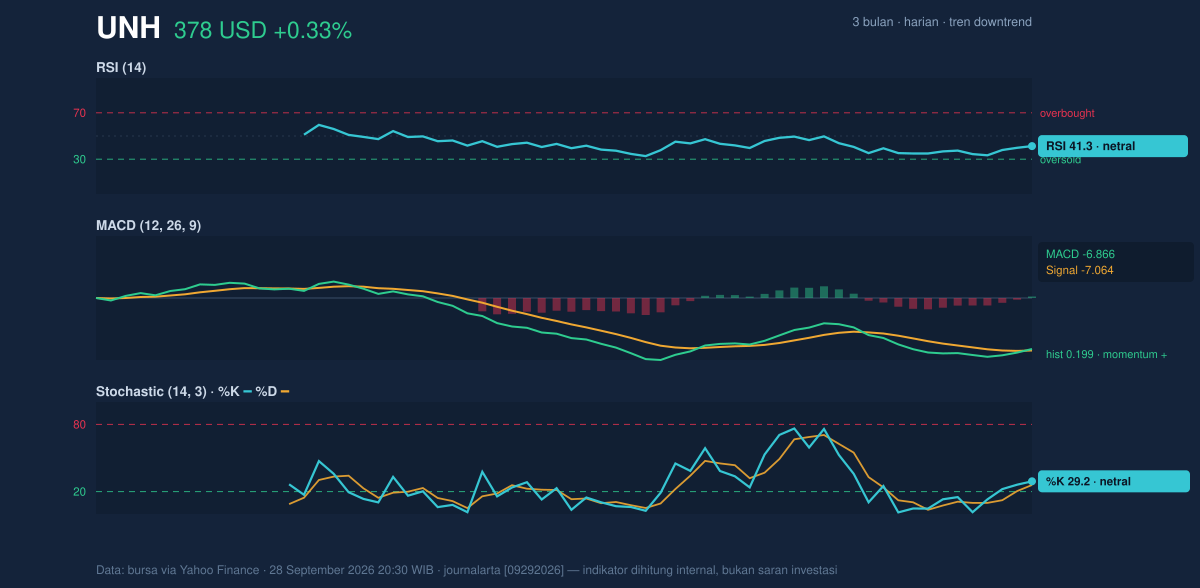
The most interesting signal is from MACD. The MACD at -6.866 remains below zero, which keeps the broader momentum negative, but the histogram at 0.199 is positive and the line is above the signal at -7.064. That means downside momentum is easing. In practical terms, the stock is still in a downtrend, but the pace of selling has slowed enough to allow for short-term stabilisation if price can hold nearby support.
Volatility & Volume
Volatility is moderate, not extreme. The ATR at 9.49, or 2.5% of price, suggests a daily move that is meaningful but not disorderly. That matters because it gives the stock enough range to build a rebound, but also enough room to slip back toward support if buyers do not show up consistently.
Volume adds a subtle but important clue. The latest session traded 4,614,700 shares, below the 20-day average of 5,225,835, or about 0.9x normal. That tells you the latest bounce was not powered by unusually strong participation. Still, the OBV is rising, which is a sign that cumulative volume flow has been improving even as the price remains capped. When OBV rises ahead of price, it often means accumulation is happening quietly rather than loudly.
Key Levels & Scenarios
The nearest pivot is support at 371.29. That level matters because it sits just above the 3-month low of 366.00 and near the lower Bollinger band at 363.84. If UNH loses 371.29, the chart opens the door to a retest of the lower band and then the recent low area. If that floor holds, the stock can continue to build a base.
On the upside, resistance at 400.94 is the first meaningful barrier, and the SMA50 at 398.41 sits just below it, creating a tight zone where rallies may stall. A move through that area would be important because it would show the stock is reclaiming intermediate trend territory, not just bouncing inside a falling range. Until then, the chart remains a recovery attempt inside a larger decline.
Technical Verdict: HOLD (wait & see)
HOLD (wait & see) is the clearest reading from the current setup.
- Price remains below SMA20 at 384.14 and SMA50 at 398.41, so the trend is still negative.
- MACD is still below zero, but the positive histogram shows downside momentum is easing.
- OBV is rising, suggesting accumulation, yet volume is only 0.9x normal, so confirmation is incomplete.
Verdict invalidated if price breaks below 371.29, because that would weaken the current support base and raise the odds of a retest toward 366.00.
- Ideal Entry Range: 371.29 to 384.14
- Exit Target: 398.41 to 400.94
- Stop Loss protection: below 366.00
For non-traders: the stock is showing early signs of stabilising, but it has not yet proved that the downtrend is over, and the next important test is whether it can hold 371.29.
Summary Data UNH
| Last price | 377.83 USD |
| Change 1 day / 5 days / 1 month | 0.33% / 0.07% / -3.85% |
| Trend / MA-cross | downtrend / none |
| SMA20 / SMA50 | 384.14 / 398.41 |
| RSI (14) / Stochastic %K | 41.3 / 29.2 |
| Bollinger %B / ATR | 34% / 9.49 |
| Support / Resistance 20 days | 371.29 / 400.94 |
| Data as of | 28 September 2026 20:30 WIB |



