American International (AIG) Stock Update: Rises 0.35%, Up 6.6% in Five Sessions
Technical analysis of AIG stock on November 13, 2026: price 82.86 USD, trend uptrend, RSI 59.5, support 77.75, resistance 83.03.
Why AIG is in focus today
Selected automatically from 8 NYSE (US) stocks by a technical-signal score with daily weighted randomisation — not a recommendation.
Trend & Price Action
AIG closed above its 20-day average of 81.30 and its 50-day average of 78.03, consistent with the data’s uptrend classification. The 20-day average rose 1.09% over five days. There was no new moving-average cross, so the trend signal comes from the price holding above both averages rather than a fresh crossover. The close stood at 97% of the 20-day range, just below resistance at 83.03 and near the three-month high of 83.91. That shows buyers have pushed the stock close to a test of resistance, while leaving little room before the recent high becomes relevant. The price structure is bullish, but it is approaching a crowded ceiling. As shown in the chart, the 20-day Bollinger bands are narrowing, with a 6.4% width. A squeeze means recent price swings have contracted; it can precede a larger move, but does not determine its direction. The close was within the bands, at 80% of the distance from the lower to the upper band.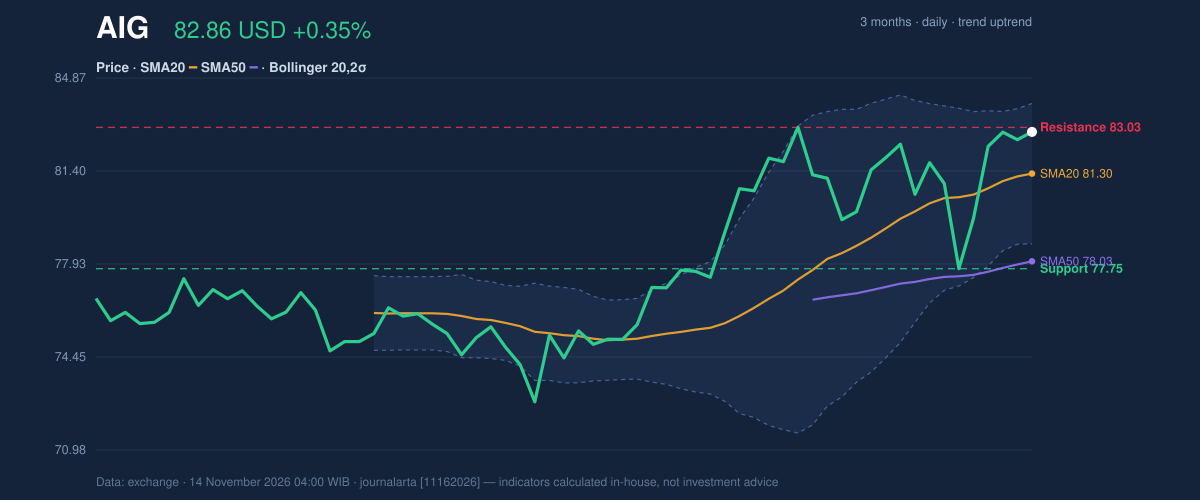
Oscillators & Momentum
The momentum measures are positive but not unanimous. RSI at 59.5 is neutral, suggesting strength without an extreme reading. Stochastic %K at 83.0 and %D at 85.5 is overbought, a sign that the recent climb may be stretched over the indicator’s short lookback. Overbought does not by itself mean a reversal; it does make a pause or pullback more plausible if buyers fail to clear resistance. MACD is positive at 1.092, above its 1.066 signal line, with a 0.026 histogram. The histogram has just turned positive, indicating improving short-term momentum. That supports the uptrend, though the narrow margin between MACD and its signal line makes follow-through important.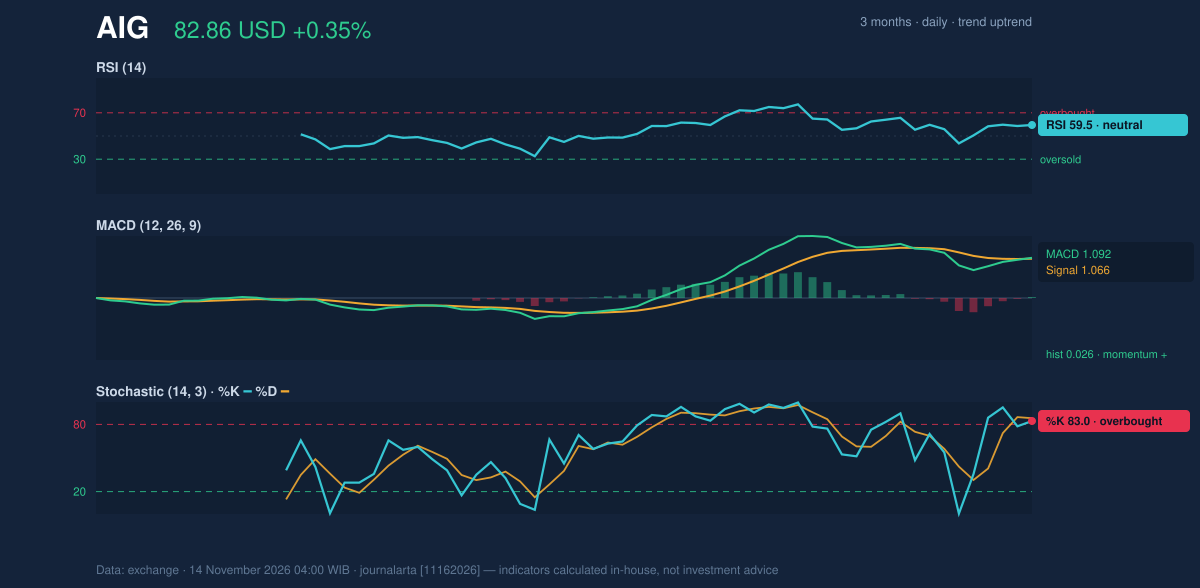
Volatility & Volume
ATR is 2.00, or 2.4% of the share price, indicating moderate recent volatility. The latest volume of 2,463,900 shares was 0.6 times the 20-day average. That lighter participation tempers the conviction behind the session’s move toward resistance: the advance has not yet been accompanied by typical trading activity. OBV is rising, however, which means cumulative volume flow is still consistent with accumulation rather than a clear distribution pattern. The levels frame the near-term test. A sustained move above 83.03 resistance would put the 83.91 three-month high in focus; failure there could leave the shares consolidating. On a pullback, 81.30, the 20-day average, is a nearby trend reference, while 77.75 is 20-day support. A break below support would weaken the technical picture.Fundamental Context
According to its SEC filing, AIG reported quarterly revenue of $7.44 billion for the quarter ended 2026-09-30, up 17.2% from $6.35 billion a year earlier. Net income was $844.0 million, compared with $519.0 million a year earlier, and diluted earnings per share were $1.60. The company filed a Form 8-K on 2026-11-03 reporting results of operations and financial condition and other material events. These figures provide company context; the verdict below follows the supplied technical signals.Technical Verdict: BUY
BUY is the JournalArta Research Verdict, supported by three bullish technical signals and no bearish signals: the MACD histogram has just turned positive, price has pulled back to the 20-day average while remaining above the 50-day average, and rising OBV confirms the uptrend. The stock is also above both moving averages, with the 20-day average above the 50-day average. The main caution is the overbought Stochastic reading and the low-volume approach to resistance. The verdict is invalidated if price falls below 79.46. - Ideal entry range: 81.37–82.86 USD - Exit targets: 87.96 USD (target 1); 93.06 USD (target 2) - Stop-loss protection: 79.46 USD - Reward/risk: 1.5 / 3.0 - Validity: through 12 Dec 2026 For non-traders, the technical setup currently favors a rising trend, while a drop below the specified stop level would undermine that reading. AIG’s latest reported session was Friday, November 13, 2026.Summary Data AIG
| Last price | 82.86 USD |
| Change 1 day / 5 days / 1 month | 0.35% / 6.57% / 2.63% |
| Trend / MA-cross | uptrend / none |
| SMA20 / SMA50 | 81.30 / 78.03 |
| RSI (14) / Stochastic %K | 59.5 / 83.0 |
| Bollinger %B / ATR | 80% / 2.00 |
| Support / Resistance 20 days | 77.75 / 83.03 |
| Data as of | 14 November 2026 04:00 WIB |
| JournalArta research verdict (score) | Buy (+92) |
| Entry zone | 81.37 – 82.86 |
| Target 1 / 2 | 87.96 / 93.06 |
| Stop loss | 79.46 |
| Reward/risk | 1.5 / 3.0 |
Disclaimer: This technical analysis is generated automatically from exchange data and indicators calculated by JournalArta, for information and education only. The verdict and the entry, target and stop-loss levels are not investment advice or a solicitation to buy or sell any security. Investment decisions and their risks rest solely with the reader.
Track AIG stock price daily: live levels, support/resistance and our full AIG analysis history.
 Take the quizWhat Kind of Holiday Spender Are You? Take the Black Friday QuizStart →
Most Read
- 1I’m A Celebrity 2026 Line-Up: Rooney Leads 11 Stars Into Jungle

- 2Mavericks Surfers Race to California for Waves Near 50 Feet

- 3NYC Medical Examiner Has Not Determined Cause of Death of Beau Rose Jessup

- 4Mountaineer Finds Ice Age Cave Bear Graveyard in the Dolomites

- 5Rugby League World Cup Final 2026: Kick-Off Times and How to Watch Kangaroos v New Zealand

Don't Miss
 Lifestyle7 Signs Your Social Battery Is Running Low (and Why You Keep Cancelling Plans)
 Lifestyle · Food & HealthThanksgiving Food Safety: How Long Leftovers Last and the Safe Turkey Temperature
 Lifestyle7 Quiet Habits of Emotionally Intelligent People, According to Psychologists
 LifestylePeople Who Don’t Like Celebrating Their Birthday Often Share These 7 Traits