S&P Global (SPGI) Stock Rises 1.08% (November 13, 2026): Up 10.2% in a Month
Technical analysis of SPGI stock on November 13, 2026: price 473.59 USD, trend uptrend, RSI 64.5, support 427.83, resistance 481.69.

Why SPGI is in focus today
Selected automatically from 8 NYSE (US) stocks by a technical-signal score with daily weighted randomisation — not a recommendation.
Trend & Price Action
The price is above its 20-day moving average of $460.67 and its 50-day average of $428.56. The shorter average is also above the longer one, while the 20-day average rose 3.09% over five days. Together, those readings describe a rising trend across both short and medium time frames; there was no new moving-average crossover in the latest session. The shares are at 85% of their 20-day range, near resistance at $481.69 and the three-month high of $485.99. That placement matters: the trend is positive, but there is less room before nearby resistance tests whether buyers can sustain the advance. As shown in the chart, the Bollinger upper band at $489.08 sits just above those levels, while the lower band is $432.26.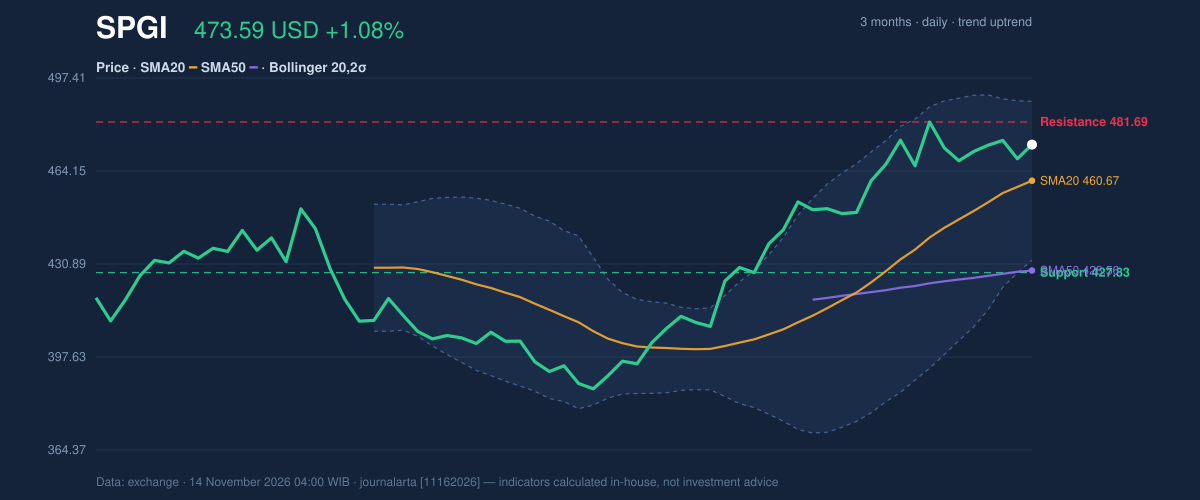
Oscillators & Momentum
The RSI is 64.5, a neutral reading within the 50–70 zone cited in JournalArta’s research verdict. Stochastic is also neutral, with %K at 70.5 and %D at 67.6. Neither measure signals an extreme, though the RSI has begun rolling over from above 65, a sign that the recent climb may be losing some pace. MACD adds a clearer caution. Its value is 13.715, below the 14.252 signal line, leaving a negative histogram of −0.537. The negative MACD histogram points to weakening momentum, even as price remains above both moving averages. This is a divergence in tone rather than a confirmed reversal: the trend measures remain constructive, while the momentum reading has softened.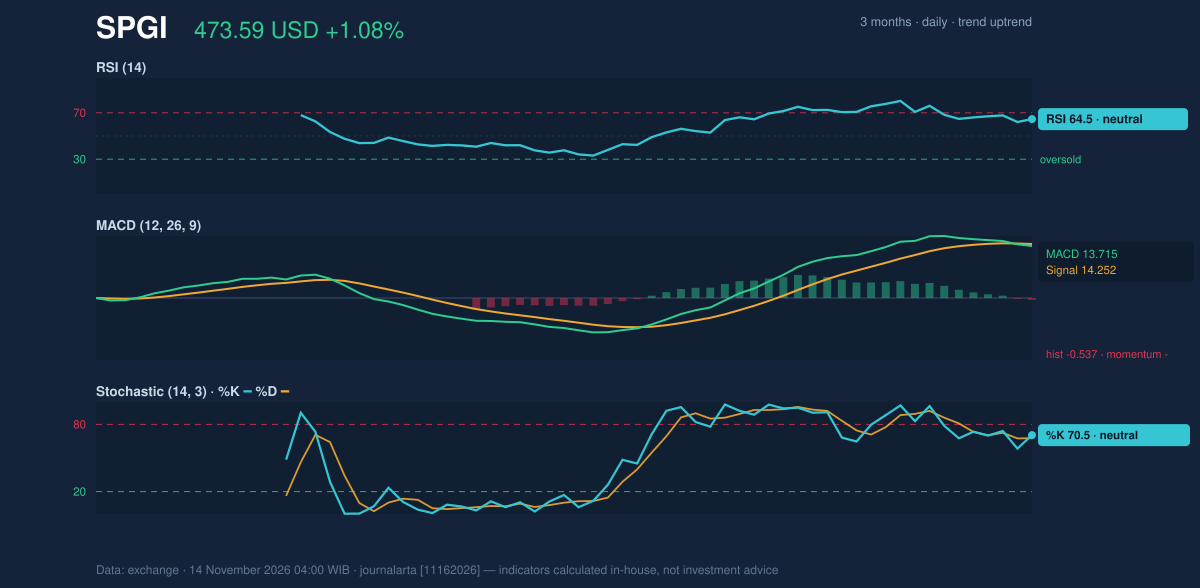
Volatility & Volume
The Bollinger band width is 12.3%, classified as normal, and %B is 73%, placing price in the upper portion of the bands without an extreme reading. ATR is $11.71, or 2.5% of the share price, indicating moderate volatility. These measures suggest that daily swings are meaningful but not unusually large against the recent price structure. Volume was 1,005,800 shares, about 0.6 times the 20-day average of 1,818,295, which the data classifies as thin. That tempers the significance of the latest advance: fewer shares changed hands than usual. On the other hand, OBV is rising, meaning cumulative buying volume still supports the broader uptrend.Key Levels & Scenarios
Resistance at $481.69 and the three-month high of $485.99 are the immediate tests. A move above that area would put the upper Bollinger band at $489.08 in view, though the supplied verdict levels set higher targets. Failure to clear resistance could leave the stock consolidating, with the 20-day average at $460.67 a nearer reference point. The 20-day support is $427.83; a break below that level would weaken the current price structure. S&P Global’s latest filing provides a business backdrop to the technical picture. According to its SEC filing, quarterly revenue for the quarter ended September 30, 2026 was $3.68 billion, up 6.8% from $3.44 billion a year earlier. Net income was $1.24 billion, compared with $1.18 billion a year earlier, and diluted earnings per share were $4.25.Technical Verdict: BUY
JournalArta’s research verdict is BUY, with a score of +68 on a scale from −100 to +100. The call is supported by price above the 50-day average, the 20-day average above the 50-day average, an uptrend, and RSI at 64.5 in the stated 50–70 zone. Rising OBV also confirms the trend, although the negative MACD histogram and the RSI rolling over from above 65 are the main near-term cautions. The verdict is invalidated if price falls below $453.70. - Ideal entry range: $464.82–$473.59 - Exit targets: $503.42 (target 1) and $533.26 (target 2) - Stop-loss protection: $453.70 - Valid until December 12, 2026 For non-traders, the technical reading remains positive, but the weakening momentum makes a reversal below the specified stop level the key risk.Summary Data SPGI
| Last price | 473.59 USD |
| Change 1 day / 5 days / 1 month | 1.08% / 1.24% / 10.23% |
| Trend / MA-cross | uptrend / none |
| SMA20 / SMA50 | 460.67 / 428.56 |
| RSI (14) / Stochastic %K | 64.5 / 70.5 |
| Bollinger %B / ATR | 73% / 11.71 |
| Support / Resistance 20 days | 427.83 / 481.69 |
| Data as of | 14 November 2026 04:00 WIB |
| JournalArta research verdict (score) | Buy (+68) |
| Entry zone | 464.82 – 473.59 |
| Target 1 / 2 | 503.42 / 533.26 |
| Stop loss | 453.70 |
| Reward/risk | 1.5 / 3.0 |
Disclaimer: This technical analysis is generated automatically from exchange data and indicators calculated by JournalArta, for information and education only. The verdict and the entry, target and stop-loss levels are not investment advice or a solicitation to buy or sell any security. Investment decisions and their risks rest solely with the reader.
Track SPGI stock price daily: live levels, support/resistance and our full SPGI analysis history.
 Take the quizWhat Kind of Holiday Spender Are You? Take the Black Friday QuizStart →
Most Read
- 1I’m A Celebrity 2026 Line-Up: Rooney Leads 11 Stars Into Jungle

- 2Mavericks Surfers Race to California for Waves Near 50 Feet

- 3NYC Medical Examiner Has Not Determined Cause of Death of Beau Rose Jessup

- 4Mountaineer Finds Ice Age Cave Bear Graveyard in the Dolomites

- 5Rugby League World Cup Final 2026: Kick-Off Times and How to Watch Kangaroos v New Zealand

Don't Miss
 Lifestyle7 Signs Your Social Battery Is Running Low (and Why You Keep Cancelling Plans)
 Lifestyle · Food & HealthThanksgiving Food Safety: How Long Leftovers Last and the Safe Turkey Temperature
 Lifestyle7 Quiet Habits of Emotionally Intelligent People, According to Psychologists
 LifestylePeople Who Don’t Like Celebrating Their Birthday Often Share These 7 Traits