Evolution Mining Share Price Tumbles 5.32% (November 18, 2026): Down 16.1% in Five Sessions
Technical analysis of Evolution Mining stock on November 18, 2026: price 11.74 AUD, trend sideways, RSI 40.2, support 11.31, resistance 14.00.

Why Evolution Mining is in focus today
- One-day move of 0.00%, about 0.0× its average daily range (ATR)
Selected automatically from 9 ASX (Australia) stocks by a technical-signal score with daily weighted randomisation — not a recommendation.
Trend & Price Action
The stock is trading below its 20-day average of 12.38 AUD and its 50-day average of 12.86 AUD, a configuration that tells you short-term holders are underwater and the medium-term trend has tilted lower. The 20-day average itself is still rising — up 0.57% over five days — but that is a lagging reflection of where prices were, not where they are now. No fresh moving-average cross has formed, which is worth noting: the market has not yet confirmed a structural breakdown signal, but the price is doing the work ahead of the indicator. The range positioning is the clearest signal. At 11.74 AUD, the stock sits just 16% of the way up its 20-day range between support at 11.31 AUD and resistance at 14.00 AUD. The three-month high of 16.20 AUD and low of 11.19 AUD frame the bigger picture: this is a stock pressing against the floor of its recent trading band, not one consolidating near highs. The last session's close is barely above the three-month low, which means the 11.31 AUD support is now the line that separates a pullback from a breakdown.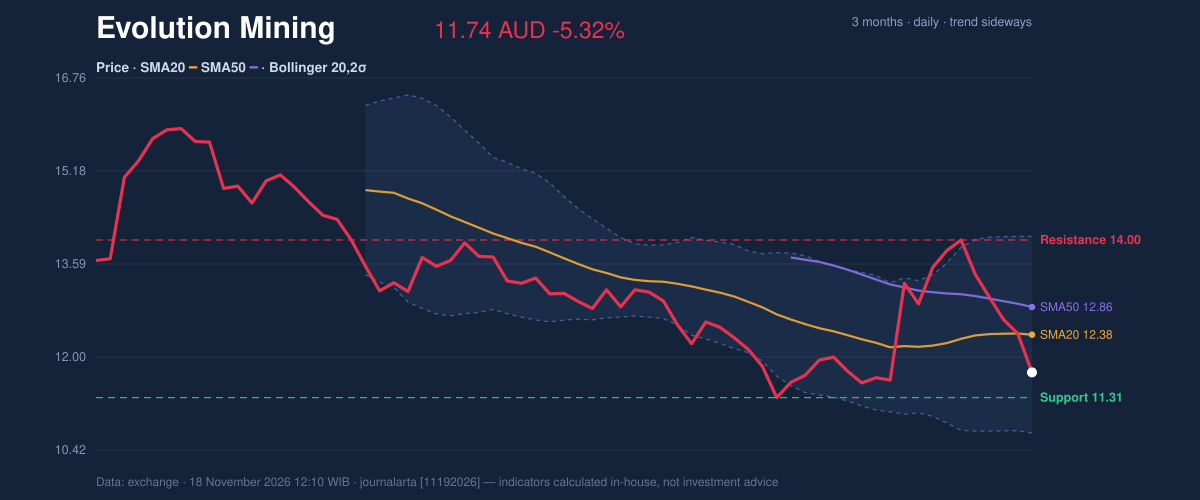
Oscillators & Momentum
The momentum picture is uniformly weak. RSI(14) at 40.2 sits in neutral territory but is rolling over from above 65 — a classic deterioration signal where buyers have lost control without the stock yet reaching oversold extremes. Stochastic %K at 14.0 against %D at 32.6 is the more acute reading: the fast line is deep in oversold territory and below the slow line, a configuration that flags selling pressure as dominant even if a short-term bounce is mechanically possible. MACD at -0.017 versus its signal line at -0.006, with a histogram of -0.011, confirms the negative turn — the histogram has just flipped negative, meaning the momentum gap is widening to the downside rather than narrowing. For a general reader: MACD measures the distance between short and medium-term price trends; a negative histogram means that distance is growing in the wrong direction. The combination of RSI rolling over and MACD turning negative is the technical driver behind the bearish signal count: zero bullish signals against two bearish ones.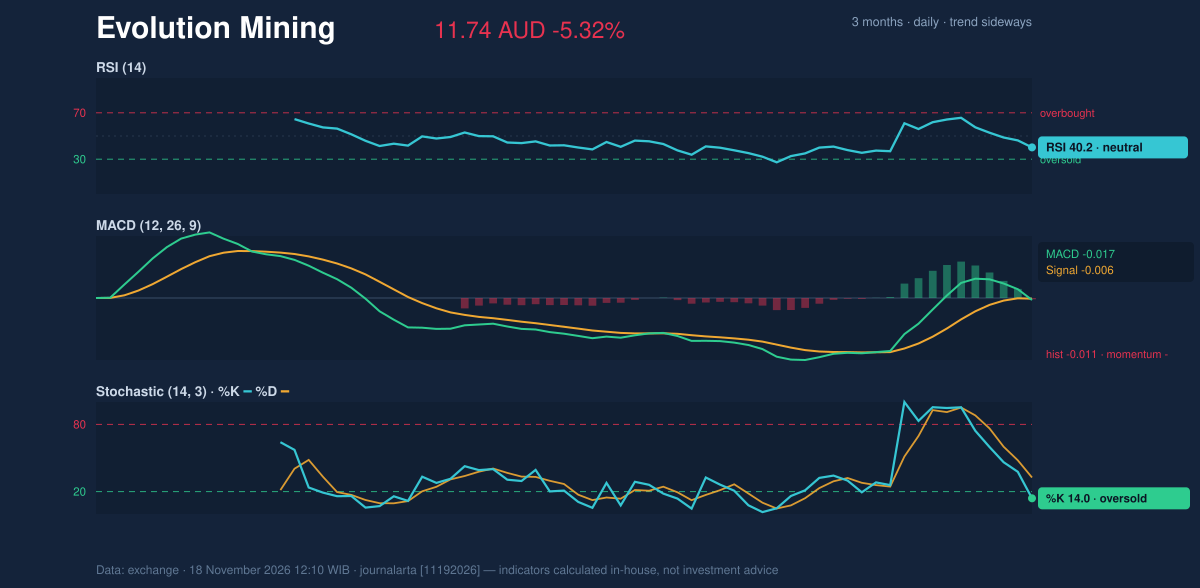
Volatility & Volume
Volatility is elevated and expanding. The Bollinger band width is 27.1% — wide, not squeezed — with the upper band at 14.06 AUD and lower band at 10.70 AUD. The %B reading of 31% places the price in the lower third of the band, consistent with the range position: not at the floor, but close enough that a further push lower would test the band's underside. ATR(14) at 0.63 AUD, or 5.3% of the price, tells you the stock routinely moves more than half a dollar a session — a high-volatility regime where stops need room and whipsaws are common. Volume adds a cautionary note. The last session traded 10,220,419 shares against a 20-day average of 8,236,329 — about 1.2 times normal — while OBV is falling. Falling on-balance volume means the volume is accumulating on down days rather than up days: participation is confirming the decline, not resisting it. That is the difference between a quiet drift and a distribution phase, and it strengthens the case that the 11.31 AUD support is under genuine pressure.Key Levels & Scenarios
The levels are clean and the scenarios conditional. Support at 11.31 AUD is the first test; a close below it would open the path toward the Bollinger lower band at 10.70 AUD and, by extension, the three-month low of 11.19 AUD becomes a memory rather than a floor. On the upside, resistance at 14.00 AUD is a long way off, with the 20-day average at 12.38 AUD as the first meaningful hurdle any rebound must clear. Until price reclaims that average, rallies are counter-trend moves within a damaged structure.Technical Verdict: SELL
The verdict is SELL, based on three converging signals: price below its 50-day average, a bearish signal count of 2 to 0, and MACD histogram just turning negative while RSI rolls over from above 65. The stock's position at 16% of its 20-day range and falling OBV reinforce that the path of least resistance is lower. - Entry Range (sell zone): 11.74 – 12.20 AUD - Exit Target 1: 10.14 AUD - Exit Target 2: 8.53 AUD - Stop Loss: 12.81 AUD - Reward/Risk: 1.5 to 3.0 - Validity: through 16 December 2026 The verdict would be invalidated if price breaks and holds above the 12.81 AUD stop level, which would put the stock back above the 20-day average and challenge the bearish structure. The reward-to-risk math is the core of the case: risking roughly 1.07 AUD to the stop against 1.60 AUD to the first target and 3.21 AUD to the second. For non-traders, the plain-English translation: the stock is weak on every measure that matters right now — trend, momentum, and volume — and the technical setup favors further downside before any durable recovery.Data Snapshot
| Indicator | Reading | |---|---| | Last Price | 11.74 AUD | | 1-Day Change | -5.32% | | 5-Day Change | -16.14% | | 1-Month Change | -3.22% | | SMA20 / SMA50 | 12.38 / 12.86 AUD | | RSI(14) | 40.2 (neutral) | | Stochastic %K / %D | 14.0 / 32.6 (oversold) | | MACD / Signal / Histogram | -0.017 / -0.006 / -0.011 | | ATR(14) | 0.63 AUD (5.3%) | | Bollinger Upper / Mid / Lower | 14.06 / 12.38 / 10.70 AUD | | %B / Band Width | 31% / 27.1% (expanding) | | Volume vs 20-Day Avg | 10,220,419 vs 8,236,329 (1.2×) | | Support / Resistance (20-day) | 11.31 / 14.00 AUD | | 3-Month High / Low | 16.20 / 11.19 AUD | | Signal Count | 0 bullish / 2 bearish | *This is technical analysis for educational purposes, not investment advice. Price levels are drawn from the data set above and do not constitute recommendations to buy or sell.*Summary Data Evolution Mining
| Last price | 11.74 AUD |
| Change 1 day / 5 days / 1 month | -5.32% / -16.14% / -3.22% |
| Trend / MA-cross | sideways / none |
| SMA20 / SMA50 | 12.38 / 12.86 |
| RSI (14) / Stochastic %K | 40.2 / 14.0 |
| Bollinger %B / ATR | 31% / 0.63 |
| Support / Resistance 20 days | 11.31 / 14.00 |
| Data as of | 18 November 2026 12:10 WIB |
| JournalArta research verdict (score) | Sell (-66) |
| Sell zone | 11.74 – 12.20 |
| Target 1 / 2 | 10.14 / 8.53 |
| Stop loss | 12.81 |
| Reward/risk | 1.5 / 3.0 |
Today's full Buy and Sell list for Australian stocks (ASX) →
Disclaimer: This technical analysis is generated automatically from exchange data and indicators calculated by JournalArta, for information and education only. The verdict and the entry, target and stop-loss levels are not investment advice or a solicitation to buy or sell any security. Investment decisions and their risks rest solely with the reader.
Track Evolution Mining share price daily: live levels, support/resistance and our full Evolution Mining analysis history.
 Take the quizWhat Kind of Holiday Spender Are You? Take the Black Friday QuizStart →
- 1U.S. Emergency Alert Test Nov. 17 Is Not a Power Outage

- 2Gold Silver Price November: Futures Rise Near Yearly Lows

- 3Michael Clarke Says Sandpapergate Scars Drew Steve Smith to New York

- 4GTA 6 New Zealand Time Trick Is Not Guaranteed to Work

- 5Sunrise on the Reaping Reviews Split Over Dark Hunger Games Prequel

 Lifestyle · Food & Health4 Reasons to Eat Oatmeal, According to Nutrition Experts
 Lifestyle7 Signs Your Social Battery Is Running Low (and Why You Keep Cancelling Plans)
 Lifestyle · Food & HealthThanksgiving Food Safety: How Long Leftovers Last and the Safe Turkey Temperature
 Lifestyle7 Quiet Habits of Emotionally Intelligent People, According to Psychologists