NFLX Stock Week Ahead: Technical Outlook for November 23–27
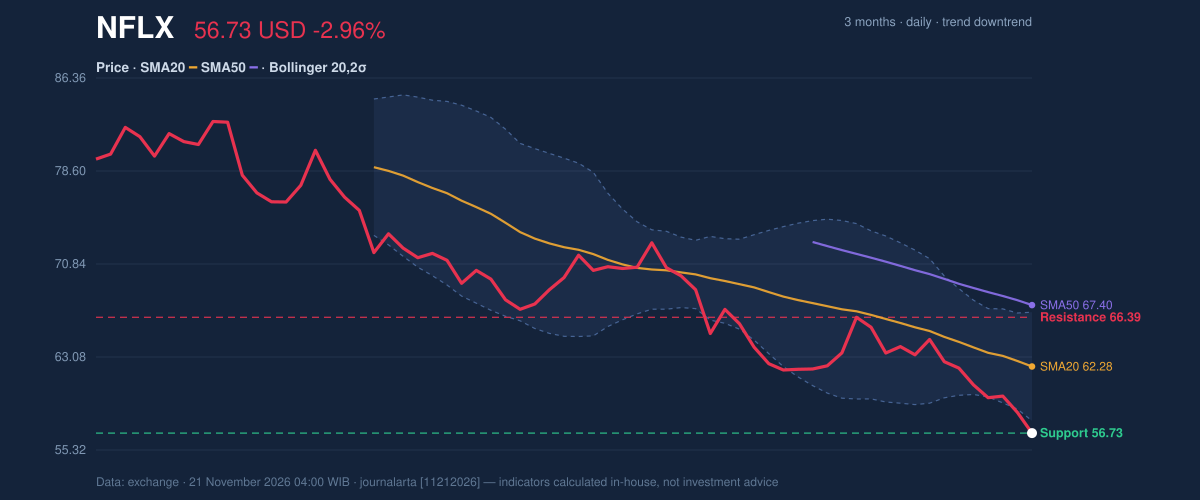
NFLX stock week ahead for November 23–27: last close 56.73 USD, weekly change -8.72%, support 56.73, resistance 66.39.

Netflix shares enter the new week in the weakest technical shape of any mega-cap streaming name, with the stock down 8.72% over the five sessions to November 20 and sitting almost exactly at its 20-day floor. For international readers, the stakes are simple: a global content spender with more than €13bn invested in Europe since 2019 is now trading below every major moving average on the chart.
Last Week in Review
The stock closed Friday, November 20 at 56.73 USD, down from 62.15 USD the prior Friday — a weekly decline of 8.72%. That compares with a 13.85% fall over the past month. The week opened at 62.89 on Monday, November 16, and the high of 62.98 was set that same session; the low of 56.56 arrived on Friday, November 20. The weekly range was 11.35%, and the close landed in the bottom 3% of that range — a sign sellers held control into the bell. Only one session finished higher: Wednesday, November 18, up 0.23%. The worst session was Friday, November 20, down 2.96%. Average daily volume for the week was 40,818,960 shares against a 20-session average of 45,772,465 — a ratio of 0.89x, so the decline was not driven by panic volume. That changed on the final day, when volume hit 67,968,000, roughly 1.7x the 20-day average.Technical Map for the Week Ahead
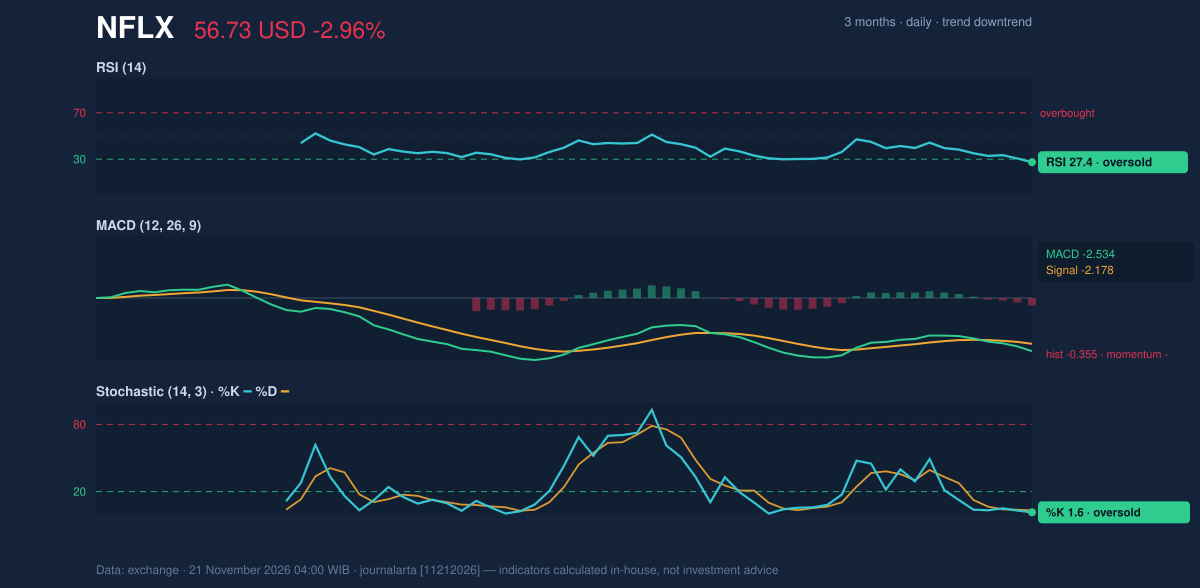
Momentum is deeply negative but also stretched. RSI(14) at 27.4 is in oversold territory; Stochastic %K at 1.6 and %D at 3.2 are pinned near the floor. MACD reads -2.534 against a signal line of -2.178, with a histogram of -0.355 — negative momentum, but the histogram is not expanding violently. ATR(14) of 2.03 represents 3.6% of the price, flagging high volatility. The 3-month high/low range is 83.60 / 56.56.
Bullish scenario: a reclaim of the 20-day average at 62.28 would be the first structural repair, and a break above resistance at 66.39 would put the stock back inside the Bollinger band with the 50-day line at 67.40 in sight. The oversold RSI and %B readings give that scenario a technical foothold.
Bearish scenario: if it slips below 56.73, the zero point of the 20-day range, the path opens toward the 3-month low of 56.56 and then the lower Bollinger territory; a decisive break of that low would confirm the downtrend the falling OBV already signals.
Fundamentals and Catalysts
The operating backdrop remains solid even as the chart weakens. Netflix reported quarterly revenue of $12.87 billion for the quarter ended September 30, 2026, up 11.8% from $11.51 billion a year earlier, per its Form 10-Q filed October 21. Net income for the same quarter was $3.66 billion versus $2.55 billion a year earlier, with diluted earnings per share of $0.87. The most recent company news is a cost signal: on November 18, Netflix announced it would lay off roughly 6% of its employees, or roughly 1,000 workers, affecting the product, tech, legal and HR teams. The last earnings date was Tuesday, October 20, after market close, meaning the next scheduled report is not imminent. On the sector side, U.S. streaming platforms added more than 3,700 hours of creator-led programming in Q3 2026, up almost 300% from 927 hours a year earlier, according to Ampere Analysis, published November 11.Macro, Political and Global Factors
The rate backdrop is not helping high-multiple growth names. The Federal Reserve kept its operating rate in the 3.75–4% range at its October 27–28 meeting, with 10 votes in favor and 2 against (reported November 19). PCE inflation rose to 3.6% in September 2026, with core PCE at 3.1% — a combination that keeps policy restrictive and discounts long-duration cash flows harder. Globally, Netflix has invested over €13bn in Europe since 2019, and non-English-language viewing now accounts for more than a third of total consumption (reported November 9). That diversification supports the subscription base but also exposes the company to European regulatory and currency conditions that a U.S.-listed stock must absorb.Risks and What Would Invalidate the Scenario
The bearish case rests on levels that are now being tested rather than projected. A close back above the 20-day average at 62.28 would weaken the downtrend thesis; a move above resistance at 66.39 would invalidate it outright. Conversely, a break below 56.73 and then the 3-month low of 56.56 would extend the move. The clearest counter-risk is mean reversion: RSI at 27.4, Stochastic %K at 1.6 and %B at -11% all say the selling is stretched, and any relief rally could be sharp given ATR of 2.03. The November 18 layoff announcement of roughly 1,000 workers adds execution risk around product and technology teams, and restrictive Fed policy at 3.75–4% with PCE at 3.6% keeps the valuation backdrop hostile.Technical Verdict for the Week: SELL
SELL is the call, with a computed score of -71 on a -100 to +100 scale. Three reasons stand out. First, the price sits below the 50-day average of 67.40 and below the 20-day average of 62.28, with the 20-day slope falling 3.19% over five days. Second, the technical signal set is 0 bullish versus 2 bearish, including a close below the 20-day low on volume at least 1.5x average and a downtrend confirmed by falling OBV. Third, MACD at -2.534 remains below its signal line at -2.178. - Entry Range (sell zone): 56.73 – 58.25 - Target 1: 51.54 - Target 2: 46.35 - Stop Loss: 60.19 - Reward/risk: 1.5 / 3.0; valid until 19 December 2026 The verdict is invalidated if price breaks above the stop at 60.19. In plain English: the chart says the stock is still falling and the momentum indicators agree, even though it is cheap enough on RSI to bounce at any moment.NFLX Week Ahead Data
| Trading week | November 16 – November 20 (5 sessions) |
| Weekly change | -8.72% (62.15 → 56.73 USD) |
| Week high / low | 62.98 (November 16) / 56.56 (November 20) |
| Best / worst session | 0.23% (November 18) / -2.96% (November 20) |
| Avg daily volume vs prior 20 sessions | 40,818,960 vs 45,772,465 (0.89x) |
| SMA20 / SMA50 | 62.28 / 67.40 |
| RSI (14) / Stochastic %K | 27.4 / 1.6 |
| Support / Resistance 20 days | 56.73 / 66.39 |
| 3-month high / low | 83.60 / 56.56 |
| Week covered | November 23–27, 2026 |
| Data as of | 21 November 2026 04:00 WIB |
| JournalArta research verdict (score) | Sell (-71) |
| Sell zone | 56.73 – 58.25 |
| Target 1 / 2 | 51.54 / 46.35 |
| Stop loss | 60.19 |
| Reward/risk | 1.5 / 3.0 |
Disclaimer: This technical analysis is generated automatically from exchange data and indicators calculated by JournalArta, for information and education only. The verdict and the entry, target and stop-loss levels are not investment advice or a solicitation to buy or sell any security. Investment decisions and their risks rest solely with the reader.
Track NFLX stock price daily: live levels, support/resistance and our full NFLX analysis history.
 Take the quizWhat Kind of Holiday Spender Are You? Take the Black Friday QuizStart →
Most Read
- 1Stock Market Today: Dow Slides 1.34% and VIX Jumps 15% at Midday

- 2Joachim Klement to Sell Stocks After S&P 500 Signal

- 3Stock Market Today: Nasdaq, S&P 500 Futures Slide as AI Selloff Deepens

- 4Kenneth Walker’s Groin Injury Puts Cardinals Game in Doubt

- 5Pat Cummins Faces Captaincy Doubts From Mitchell Johnson

Don't Miss
 Markets · FintechHow to Calculate Compound Interest: Formula, Examples and the Rule of 72
 Lifestyle · Food & HealthNormal Blood Pressure Chart by Age: Healthy Ranges Explained
 Lifestyle · Food & HealthWhat Is Raynaud’s Syndrome? Why Fingers Turn White in the Cold
 Lifestyle · Food & Health4 Ways Walking After Meals Helps Your Body, Doctors Say