RTX Stock Week Ahead (Nov 16–20): After a 4.77% Weekly Gain
RTX stock week ahead for November 16–20: last close 198.58 USD, weekly change 4.77%, support 189.53, resistance 203.82.
For global investors tracking defense and aerospace exposure, RTX Corporation heads into the week of November 16–20 on the strongest footing in a month: 198.58 USD at the Friday, November 13 close, up 4.77% on the week. The stock sits above both its 20-day and 50-day averages. Volume, though, was thin.
Last Week in Review
RTX closed the November 9–13 week at 198.58 USD, against 189.53 USD at the November 6 close. The weekly gain of 4.77% came from four up sessions and one down session.
The week opened with its best day. The weekly high of 204.27 came on Thursday, November 12, which was also the worst session at -1.46%. The shares gave back ground from the peak. The weekly range was 6.69%, and the Friday close sat at 56% of it. The final session added just 0.11%.
Participation was light. Average daily volume for the week was 4,006,000 shares, or 0.66 times the 20-session average of 6,046,545. Friday's 2,886,500 shares were about half the 20-day norm of 5,801,270. A rally on thin trading is a weaker signal than one on heavy volume.
Technical Map for the Week Ahead
The trend reads as an uptrend, with the 20-day average sloping up 1.49% over five days. That figure is the slope of the average, not the stock's price change. Price is above the SMA20 at 196.56, which in turn is above the SMA50 at 192.80. No new moving-average crossover has formed.
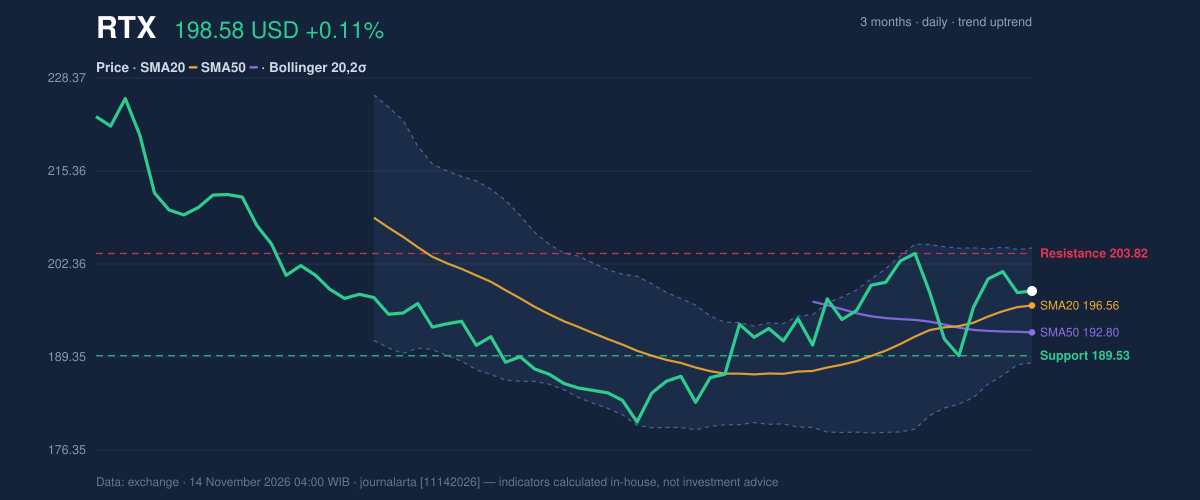
The 20-day range runs from support at 189.53 to resistance at 203.82, and the price sits at 63% of that range. The Thursday peak of 204.27 poked just above that resistance but stopped short of the upper Bollinger band at 204.59. The middle band is 196.56 and the lower band 188.52. Band width is 8.2%, which is normal, and %B is 63%. The three-month high and low are 226.41 and 179.02.
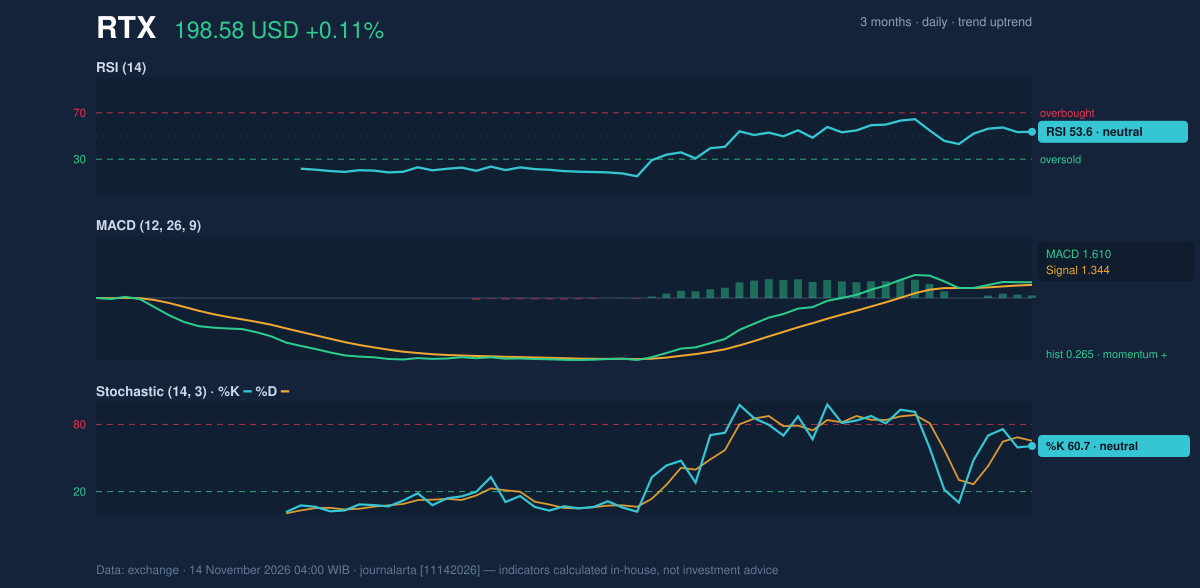
Momentum is positive but unstretched. RSI(14) is 53.6, neutral, and the Stochastic reads 60.7 (%K) and 65.3 (%D), also neutral. MACD is 1.610 against a signal line of 1.344, a histogram of 0.265. On-balance volume is rising. ATR(14) is 5.57, or 2.8% of the price, a moderate level of daily swing.
Bullish scenario: if RTX breaks above the 20-day resistance at 203.82, it would clear Thursday's high area and test the upper Bollinger band at 204.59. A sustained move there would put the first target of 213.83 in play.
Bearish scenario: if it slips below the SMA20 at 196.56, the next markers are the SMA50 at 192.80 and the 20-day support at 189.53. A loss of 189.53 would bring the lower band at 188.52 into view.
Fundamentals and Catalysts
RTX's latest filing is the strongest fundamental fact for the week. The company reported quarterly revenue of $24.97 billion for the quarter ended September 30, up 11.1% from $22.48 billion a year earlier, according to its Form 10-Q filed on October 20.
Profit rose faster than sales. Net income for the same quarter was $2.58 billion, compared with $1.92 billion a year earlier, and diluted earnings per share were $1.89, as reported on October 20.
Investor attention has also picked up. RTX was reported on November 12 to have recently been among the most searched stocks on a financial data platform. The same report said the Aerospace - Defense industry, to which RTX belongs, has gained 8.1% over the period it measured. RTX's own weekly gain of 4.77% is smaller than that sector figure, though the window is not defined, so the two are not a like-for-like comparison.
No earnings or dividend date has been confirmed for the coming week.
Risks and What Would Invalidate the Scenario
The clearest warning is volume. Friday's session ran at about 0.5 times the 20-day average, so the week's gains were not confirmed by heavy trading. Thursday's pullback from 204.27 to the 198.58 close also shows sellers appeared near the top of the range. The weekly high marks the edge of 20-day resistance, and the stock has not yet closed above it.
On the downside, the stop-loss level of 188.41 sits just beneath the lower Bollinger band at 188.52 and the 20-day support at 189.53. A move below it would break the uptrend structure behind the scenario. The 3-month high of 226.41 also remains well above the current price, and ATR of 5.57 means a single normal day can span roughly 2.8%.
Technical Verdict for the Week: BUY
JournalArta's research model scores RTX at +76 on a scale of -100 to +100, above the +60 threshold for a BUY call. Its drivers are the price above the 50-day average, two bullish technical signals against none bearish, the 20-day average above the 50-day, and a confirmed uptrend.
The strongest reasons:
- Trend structure: price at 198.58 is above the SMA20 (196.56) and SMA50 (192.80), with the SMA20 sloping up 1.49% over five days.
- Pullback within an uptrend: price is close to the SMA20, one of the two bullish signals flagged.
- Volume and momentum: on-balance volume is rising and the MACD histogram is positive at 0.265, though RSI at 53.6 leaves room before overbought territory.
Levels computed by the model:
- Entry range: 194.41 – 198.58
- Target price 1: 213.83 (reward/risk 1.5)
- Target price 2: 229.09 (reward/risk 3.0)
- Stop loss: 188.41
The verdict is invalidated if the price falls below 188.41. It is valid until December 12, 2026. This is technical analysis, not an investment recommendation, and the site disclaimer applies.
In plain terms: the chart currently favors RTX holders, but the case rests on price holding above 188.41 and volume returning.
RTX Week Ahead Data
| Trading week | November 9 – November 13 (5 sessions) |
| Weekly change | 4.77% (189.53 → 198.58 USD) |
| Week high / low | 204.27 (November 12) / 191.47 (November 9) |
| Best / worst session | 3.58% (November 9) / -1.46% (November 12) |
| Avg daily volume vs prior 20 sessions | 4,006,000 vs 6,046,545 (0.66x) |
| SMA20 / SMA50 | 196.56 / 192.80 |
| RSI (14) / Stochastic %K | 53.6 / 60.7 |
| Support / Resistance 20 days | 189.53 / 203.82 |
| 3-month high / low | 226.41 / 179.02 |
| Week covered | November 16–20, 2026 |
| Data as of | 14 November 2026 04:00 WIB |
| JournalArta research verdict (score) | Buy (+76) |
| Entry zone | 194.41 – 198.58 |
| Target 1 / 2 | 213.83 / 229.09 |
| Stop loss | 188.41 |
| Reward/risk | 1.5 / 3.0 |
Today's full Buy and Sell list for US stocks →
Disclaimer: This technical analysis is generated automatically from exchange data and indicators calculated by JournalArta, for information and education only. The verdict and the entry, target and stop-loss levels are not investment advice or a solicitation to buy or sell any security. Investment decisions and their risks rest solely with the reader.
Track RTX stock price daily: live levels, support/resistance and our full RTX analysis history.