GSK Stock Week Ahead: Levels and Scenarios for November 16–20
GSK stock week ahead for November 16–20: last close 1,911.50 GBp, weekly change 1.14%, support 1,814.00, resistance 1,923.50.
By Alistair Sterling
November 14, 20265 min read
Logo GSK plc — JournalArta illustration
GSK plc enters the week of November 16–20 at 1,911.50 GBp, up 1.14% on the week and sitting just under the top of its 20-day range. The move came on thin trading. Volume ran at roughly half its recent norm.
Last Week in Review
GSK closed the London session on November 13 at 1,911.50 GBp, against 1,890.00 GBp a week earlier. That is a weekly gain of 1.14%. The shares opened the week at 1,885.00.
The weekly high of 1,944.50 came on November 10. The low of 1,875.50 followed on November 11, the week's worst session at -1.56%. The best session was November 9, at +0.77%. Four sessions rose and one fell. The full range was 3.68%, and the close landed at 52% of it.
Participation was light. Average daily volume was 4,065,177 shares, against 7,709,822 over the prior 20 sessions, or 0.53 times the norm. The Friday session was lighter still at 3,101,064, about half of the 20-day average of 6,579,920.
Advertisement
Technical Map for the Week Ahead
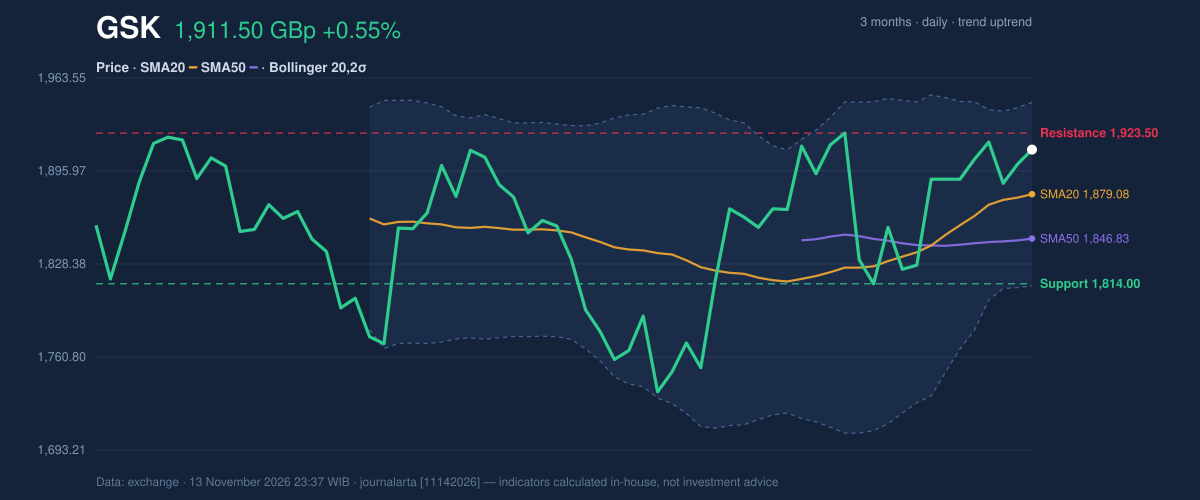
The trend is up. The 20-day moving average (SMA20) sits at 1,879.08 and the 50-day (SMA50) at 1,846.83. The price is above both, and the SMA20 is rising at 1.21% over five days. That figure measures the slope of the average, not the stock's price change. No new moving-average crossover formed last week.
3-month price action chart of GSK: price, SMA20/50, Bollinger, support & resistance.
The 20-day range runs from support at 1,814.00 to resistance at 1,923.50. The price sits at 89% of that range. The three-month range is wider, with a high of 2,158.00 and a low of 1,735.50, so the stock is still well below its recent peak.
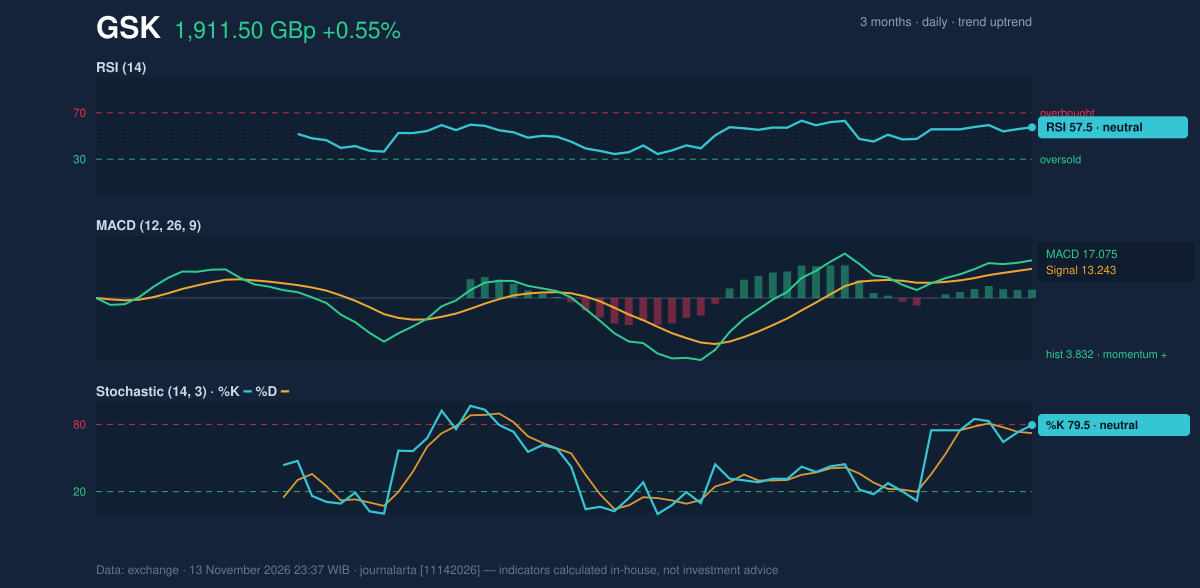
Momentum is positive but not stretched. RSI(14), a gauge of recent buying strength, reads 57.5, in neutral territory. MACD stands at 17.075 against a signal line of 13.243, a histogram of 3.832. Stochastic %K is 79.5 against %D at 72.3. On-balance volume, a running tally of volume on up days versus down days, is rising.
Momentum chart of GSK: RSI(14), MACD, Stochastic.
Advertisement
Bollinger Bands, which track volatility around the SMA20, are narrowing. The upper band is at 1,945.82 and the lower at 1,812.33, a width of 7.1%. The %B reading of 74% puts the price in the upper part of the channel. Narrow bands often precede a sharper move, though they do not signal its direction. The average true range (ATR) of 50.30 is 2.6% of the price, a moderate daily swing.
Bullish scenario: if the shares break above 1,923.50 and hold, the next reference points are the upper Bollinger Band at 1,945.82 and last week's high of 1,944.50. A close above those levels would extend the uptrend toward the three-month highs.
Bearish scenario: if the shares slip below the SMA20 at 1,879.08, the focus shifts to the SMA50 at 1,846.83. A move under 1,814.00 would break the 20-day support and put the lower band at 1,812.33 in play.
Advertisement
Fundamentals and Catalysts
The research set for this week holds one company fact, published on November 13: GSK, together with its subsidiaries, researches, develops and manufactures vaccines, specialty medicines and general medicines. It sells them in the United Kingdom, the United States and internationally. That is a business description, not a catalyst.
No earnings dates, dividend dates, regulatory decisions or trial readouts for the week of November 16–20 appear in the research. None are assumed here. The week's trading will therefore rest mainly on the chart.
Macro, Political and Global Factors
The research set contains no dated macro, policy or global facts relevant to GSK for the coming week. This section is left without commentary rather than filled with assumptions.
Advertisement
Risks and What Would Invalidate the Scenario
The constructive reading depends on a few levels holding.
- 1,879.08 (SMA20): a close below it would weaken the pullback-within-an-uptrend pattern behind the current bullish signals.
- 1,814.00 (20-day support): a break would invalidate the bullish setup. The lower Bollinger Band at 1,812.33 sits almost on top of it.
- 1,803.94: the stop-loss level used in the verdict below.
There are also softer cautions in the data. Last week's rise came on volume at 0.53 times the 20-day pace, so conviction behind the move is unproven. The price sits at 89% of its 20-day range, with Stochastic %K near 80, so there is limited room before resistance at 1,923.50. A squeeze in the Bollinger Bands can also resolve downward. The ATR of 50.30 means an ordinary day can move the price by about that amount in either direction.
Advertisement
Technical Verdict for the Week: BUY
The JournalArta research score for GSK is +76 on a scale of -100 to +100, above the +60 threshold for a BUY reading. The verdict is BUY on technical grounds.
The strongest reasons:
- Trend and averages: the price is above the SMA50 of 1,846.83, and the SMA20 of 1,879.08 is above it, in a confirmed uptrend.
- Signals: two bullish technical signals and none bearish. One is a pullback to the SMA20 within an uptrend. The other is uptrend confirmation from rising on-balance volume.
- Momentum: the MACD histogram is positive at 3.832, and RSI at 57.5 leaves room before overbought territory.
The verdict is invalidated if the price breaks below 1,803.94. The levels, all computed from the data and valid until December 11, 2026:
- Entry range: 1,873.80 – 1,911.50
- Target 1: 2,072.84
- Target 2: 2,234.18
- Stop loss: 1,803.94
- Reward/risk: 1.5 to Target 1, 3.0 to Target 2
This is technical analysis, not investment advice, and the site disclaimer applies. In plain terms, the chart for GSK currently leans positive, and it stops leaning that way if the shares fall below 1,803.94.
Disclaimer: This technical analysis is generated automatically from exchange data and indicators calculated by JournalArta, for information and education only. The verdict and the entry, target and stop-loss levels are not investment advice or a solicitation to buy or sell any security. Investment decisions and their risks rest solely with the reader.