Intel (INTC) Stock Falls 2.09% (November 10, 2026): RSI Oversold
Technical analysis of INTC stock on November 10, 2026: price 58.13 USD, trend downtrend, RSI 28.8, support 52.25, resistance 98.12.
Why INTC is in focus today
- RSI(14) at 28.8 — oversold zone
- Downtrend extending (5-day change -4.00%)
Selected automatically from 100 NASDAQ (US) stocks by a technical-signal score with daily weighted randomisation — not a recommendation.
Trend & Price Action
The share price remains well below both key moving averages: the 20-day average is $78.74 and the 50-day average is $96.72. A moving average smooths daily fluctuations to show the broader direction; here, the gap between price and both averages points to sustained weakness rather than a brief dip. The 20-day average itself fell 13.45% over five days, and no new moving-average crossover was recorded. Intel sits at just 13% of its 20-day trading range, whose support is $52.25 and resistance is $98.12. The 20-day Bollinger bands—bands that widen as price volatility increases—span from $45.47 to $112.01. With the price positioned at 19% of that band, shares are near the lower end, while the 84.5% band width signals unusually high volatility rather than a settled base.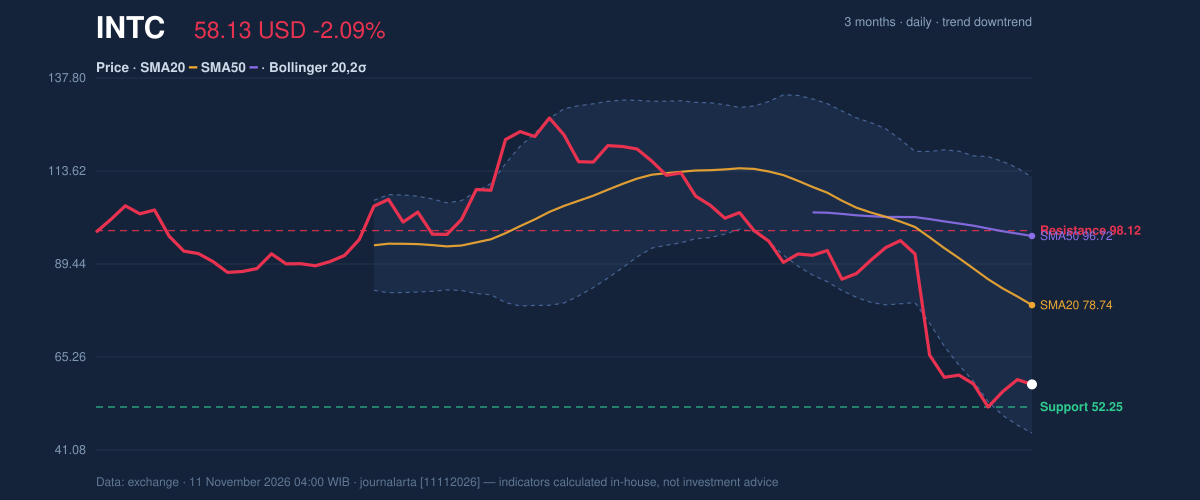
Oscillators & Momentum
The momentum indicators reinforce the oversold reading but do not yet confirm a reversal. The Stochastic oscillator, which compares a closing price with its recent trading range, is also oversold: %K is 15.0 and %D is 14.5. When both measures are this low, selling pressure has been pronounced; prices can nevertheless remain oversold during a continuing decline. MACD, a trend-and-momentum indicator, remains negative at -12.555, below its signal line at -10.253. Its histogram is also negative at -2.302, indicating that bearish momentum remains in place. The combination matters: low RSI and Stochastic readings suggest potential exhaustion, but negative MACD does not provide confirmation that buyers have taken control.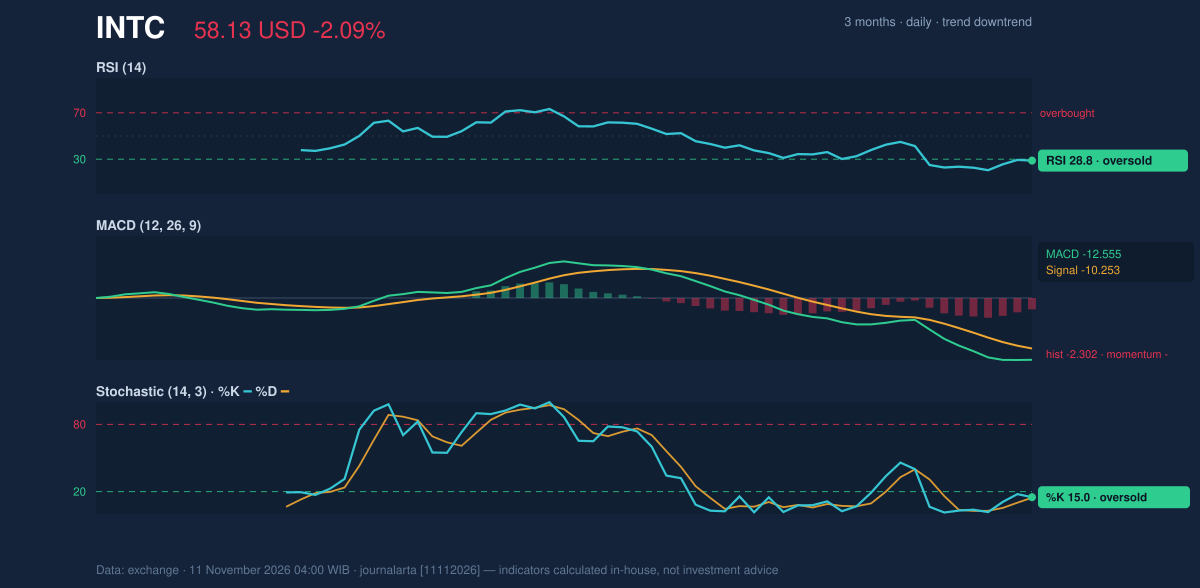
Volatility & Volume
Average true range, which estimates typical price movement, is $6.47, equal to 11.1% of the share price. That is a wide daily movement relative to the stock’s level, so technical thresholds may be tested sharply. The latest volume was 100,389,700 shares, about 0.7 times the 20-day average of 148,260,065. Meanwhile, falling on-balance volume (OBV)—a running measure that uses volume to track buying and selling pressure—supports the downtrend reading: participation has not yet turned into evidence of sustained accumulation.Fundamental Context
The technical picture contrasts with improving quarterly revenue. According to its SEC filing, Intel reported revenue of $16.51 billion for the quarter ended 2026-09-26, up 20.9% from $13.65 billion a year earlier. Net income was $3.32 billion, compared with $4.06 billion a year earlier, and diluted earnings per share were $0.60. The filing shows stronger sales alongside lower net income, a divergence that gives context to the business but does not overturn the price and momentum signals.Technical Verdict: HOLD (wait & see)
The required technical call is HOLD (wait & see). The main reasons are that Intel remains below its 50-day average, its 20-day average is below its 50-day average, and falling OBV confirms the downtrend; the RSI and Stochastic oversold readings are not yet matched by positive MACD momentum. The verdict is invalidated if the price breaks below $52.25, the 20-day support. - Conditional entry range: $98.12 and above, only if the price closes above the 20-day resistance. - Conditional exit target: $127.44, the three-month high, in that upside scenario. - Stop-loss protection: $52.25 for the upside scenario; a break below that 20-day support marks the downside scenario. In plain English, the indicators favor waiting for a clear break above resistance or recognize that a support failure would deepen the bearish setup. | Indicator | Reading | |---|---:| | Last price | $58.13 | | RSI (14) | 28.8 | | MACD / signal / histogram | -12.555 / -10.253 / -2.302 | | 20-day support / resistance | $52.25 / $98.12 | | Three-month low / high | $51.51 / $127.44 |Summary Data INTC
| Last price | 58.13 USD |
| Change 1 day / 5 days / 1 month | -2.09% / -4.00% / -43.46% |
| Trend / MA-cross | downtrend / none |
| SMA20 / SMA50 | 78.74 / 96.72 |
| RSI (14) / Stochastic %K | 28.8 / 15.0 |
| Bollinger %B / ATR | 19% / 6.47 |
| Support / Resistance 20 days | 52.25 / 98.12 |
| Data as of | 11 November 2026 04:00 WIB |
| JournalArta research verdict (score) | Hold (-58) |
Today's full Buy and Sell list for US stocks →
Disclaimer: This technical analysis is generated automatically from exchange data and indicators calculated by JournalArta, for information and education only. The verdict and the entry, target and stop-loss levels are not investment advice or a solicitation to buy or sell any security. Investment decisions and their risks rest solely with the reader.
Track INTC stock price daily: live levels, support/resistance and our full INTC analysis history.