Momentum Weakens, HD Stock Gains 2.00% Today
On Agustus 4, 2026: price 340.02 USD, trend sideways, RSI 47.1, support 324.71, resistance 350.65. technical analysis of hd stock. Momentum Weakens — full…

Home Depot shares rose to 340.02 USD on the NYSE, up 2.00% from the prior close, but the move sits inside a broader pattern that still looks more like consolidation than a clean trend change. The stock is trading above its SMA20 at 337.76 and above its SMA50 at 330.97, which keeps the intermediate structure constructive, yet the chart also shows a sideways trend and a negative MACD histogram, meaning recent price gains have not yet been fully backed by momentum. In plain terms: the shares have stopped falling, but they have not decisively re-accelerated.
Trend & Price Action
As shown in the chart, Home Depot is sitting in the upper half of its recent trading band, with the last price at 340.02 and the 20-hour support-resistance range spanning 324.71 to 350.65. That positioning matters because it suggests the market is willing to pay above the short-term average, but not yet willing to commit to a breakout above resistance. The stock’s 5-day gain of 2.11% offsets a 1-month decline of 5.00%, which is classic late-range behavior: buyers are stepping in, yet the prior down drift has not been fully erased. The SMA20 is still sloping lower by 1.13% over 5 days, so the short-term trend remains soft even though price is above it.
The broader range also frames the story. Home Depot is trading below the 3-month high of 358.85 and well above the 3-month low of 289.10, leaving room on both sides. That is not a trend breakout. It is a market trying to decide whether the recent bounce is a pause or the start of something more durable.
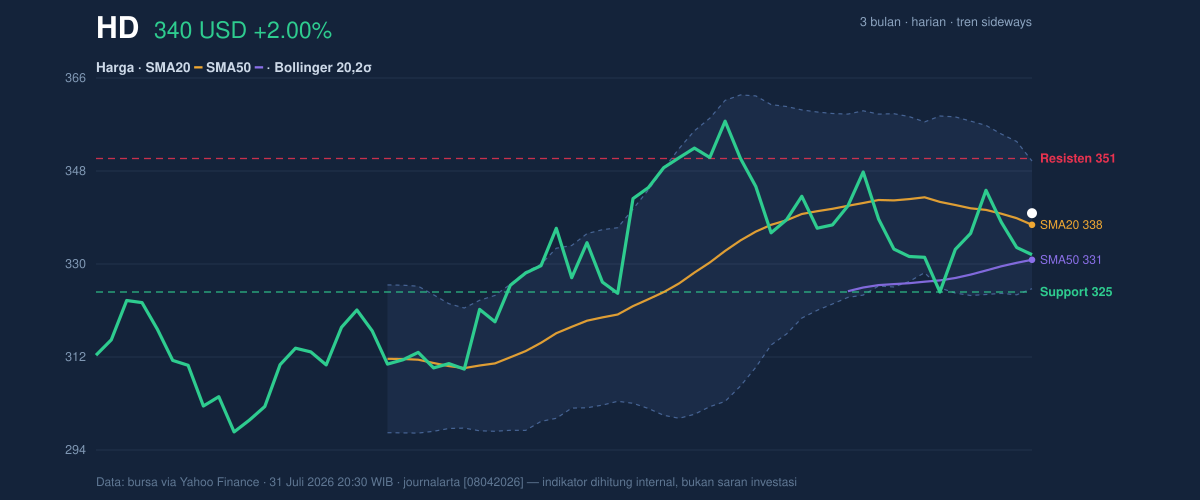
A short line says a lot here: price is improving, but structure is not yet decisive.
Oscillators & Momentum
The momentum picture is mixed, and that is the key signal. The RSI at 47.1 is neutral, which means the stock is neither stretched nor washed out. Neutral RSI often tells traders that the market has energy left, but no strong conviction in either direction. The Stochastic %K at 28.8 and %D at 37.1 lean toward the lower end of the range, hinting that short-term price pressure has been weak, though not yet formally oversold. In other words, the oscillator setup suggests the stock may have room to recover, but it has not confirmed a strong rebound.
The more important warning comes from MACD. The MACD at 0.107 is below the signal line at 1.167, and the histogram at -1.060 shows the gap is still negative. For readers unfamiliar with the term, MACD compares recent price momentum with a slower trend measure; when the histogram is negative, it means short-term momentum is lagging the longer trend. That does not automatically mean the stock is falling, but it does mean the rally has not yet won the argument.
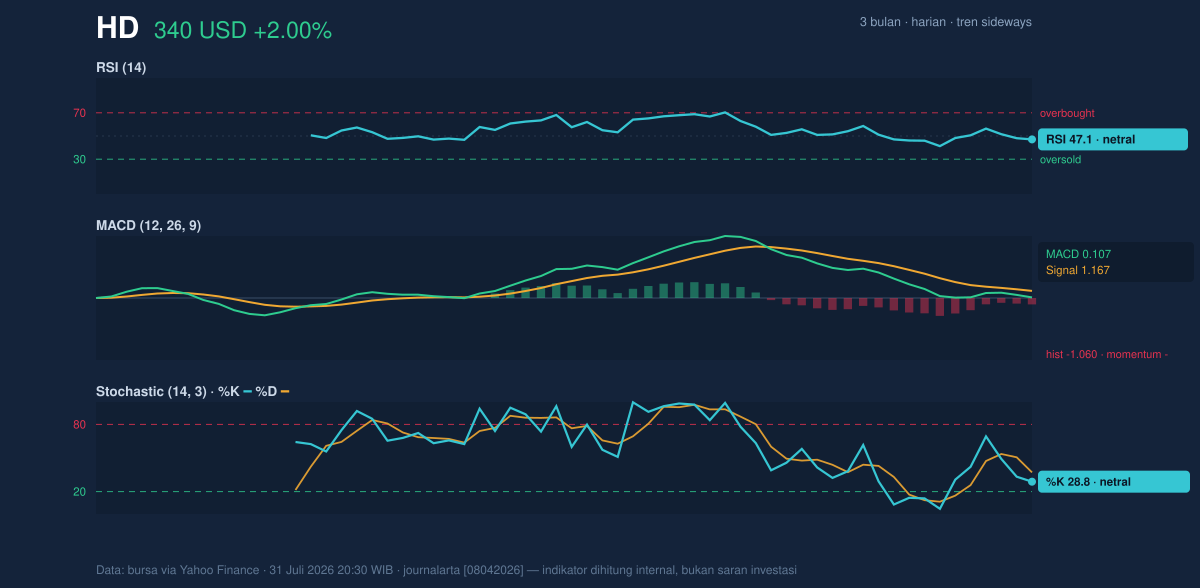
So the price is holding up better than the momentum is.
Volatility & Volume
The Bollinger Bands add another useful layer. The band range is narrow, with the upper band at 350.17, the middle band at 337.76, and the lower band at 325.35. The 7.4% band width indicates a squeeze, which usually signals compressed trading and the potential for a larger move once price escapes the range. Because the last price is at 59% of the band, the stock is leaning closer to the upper half of the squeeze than the lower half, but it has not yet pushed through the ceiling.
Volume supports the idea that interest is returning, though not explosively. Last volume was 4,961,900, about 1.3× the 20-day average of 3,908,460. That is meaningful because a move on above-average volume is more credible than one on thin turnover. Still, OBV is down, which means the cumulative volume trend has not fully turned in favor of buyers. Put simply, the latest session drew more participants, but the broader buying pressure remains uneven.
ATR, or average true range, is 8.81, equal to 2.6% of price. That points to moderate volatility: enough for a real breakout if momentum improves, but not so wild that every swing is noise. For a squeeze setup like this, that matters. A compressed band with moderate ATR can produce a sharp directional move once the market chooses a side.
Key Levels & Scenarios
The immediate map is clear. 350.65 is the first resistance to watch, sitting just above the Bollinger upper band at 350.17. A clean move through that zone would suggest the squeeze is resolving upward and could invite a test of the 3-month high at 358.85. On the downside, 337.76 is the SMA20 and the Bollinger midline, so a loss of that area would weaken the current bounce and shift attention toward 330.97, the SMA50. Below that, the 324.71 support level becomes the key floor.
If price holds above the middle band and keeps volume above average, the market is signaling stabilization. If it slips back under the SMA20, the recent strength starts to look like a temporary rebound rather than a trend reversal.
Technical Verdict: HOLD (wait & see)
HOLD (wait & see) fits the current setup because price is above the short and medium moving averages, but momentum remains soft and the MACD is still negative.
- Reason 1: Price is above SMA20 and SMA50, which keeps the structure constructive.
- Reason 2: MACD is negative and the histogram remains below zero, so momentum has not confirmed the rebound.
- Reason 3: Bollinger Bands are in a squeeze, suggesting a move is coming, but direction is not yet proven.
- Verdict invalidated if price falls below 324.71, because that would break the 20-hour support and weaken the current base.
- Ideal Entry Range: 337.76 to 340.17, using the SMA20 and the middle Bollinger band as the decision zone.
- Exit Target: 350.17 to 350.65, aligned with the upper Bollinger band and nearby resistance.
- Stop Loss protection: 324.71, the nearest support from the 20-hour range.
In plain English: the stock is holding up, but it still needs to prove that the latest bounce is more than a pause.
Summary Data HD
| Last price | 340.02 USD |
| Change 1 day / 5 days / 1 month | 2.00% / 2.11% / -5.00% |
| Trend / MA-cross | sideways / none |
| SMA20 / SMA50 | 337.76 / 330.97 |
| RSI (14) / Stochastic %K | 47.1 / 28.8 |
| Bollinger %B / ATR | 59% / 8.81 |
| Support / Resistance 20 days | 324.71 / 350.65 |
| Data as of | 31 Juli 2026 20:30 WIB |
Track HD stock price daily: live levels, support/resistance and our full HD analysis history.


