TSLA Stock Gains 0.68%, Momentum Gains In Focus
On Agustus 17, 2026: price 342.27 USD, trend sideways, RSI 48.7, support 298.32, resistance 378.93. technical analysis of tsla stock. TSLA Stock Gains — full…

Tesla shares traded higher on NASDAQ on 14 August 2026, with TSLA at 342.27 USD after closing at 339.96. The move was modest in daily terms, but it matters because the stock is trying to stabilize after a 1 month decline of 10.13% even as short-term buying has improved over the past 5 days. That combination — firmer near-term price action inside a broader soft patch — is what makes the current setup more about repair than breakout confirmation.
Trend & Price Action
Tesla remains in a sideways trend, and that is the most important signal in the chart. Sideways does not mean directionless; it usually means the market is deciding whether a prior decline has run its course or whether rallies are still being sold into. The stock is above SMA20 at 329.14, which tells us the latest bounce has recovered the short-term average, but it is still below SMA50 at 371.09, so the medium-term trend has not yet fully repaired.
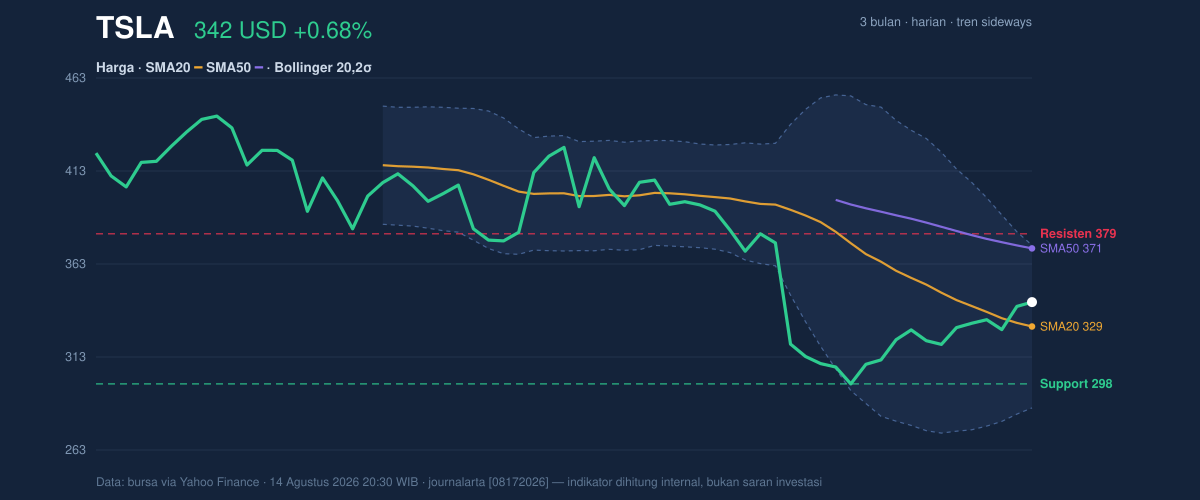
As shown in the chart, the price is sitting around the middle of its recent range, at 55% of the 20-hour range, which is a neutral-to-firm position rather than a stretched one. The 20-hour support at 298.32 is still well below current levels, while 20-hour resistance at 378.93 and the Bollinger upper band at 372.82 define the first serious overhead test. In plain terms, Tesla has room to improve, but it has not yet proven it can push through the area where sellers are likely to reappear.
The absence of a fresh MA-cross is also telling. A moving-average crossover often marks a change in trend, but no new cross means the market has not yet delivered that kind of confirmation. With the SMA20 slope at -4.13% over 5 days, the short-term trend is still easing even though price is trading above that average. That is a classic “bounce inside a weak trend” pattern, not a clean reversal.
Oscillators & Momentum
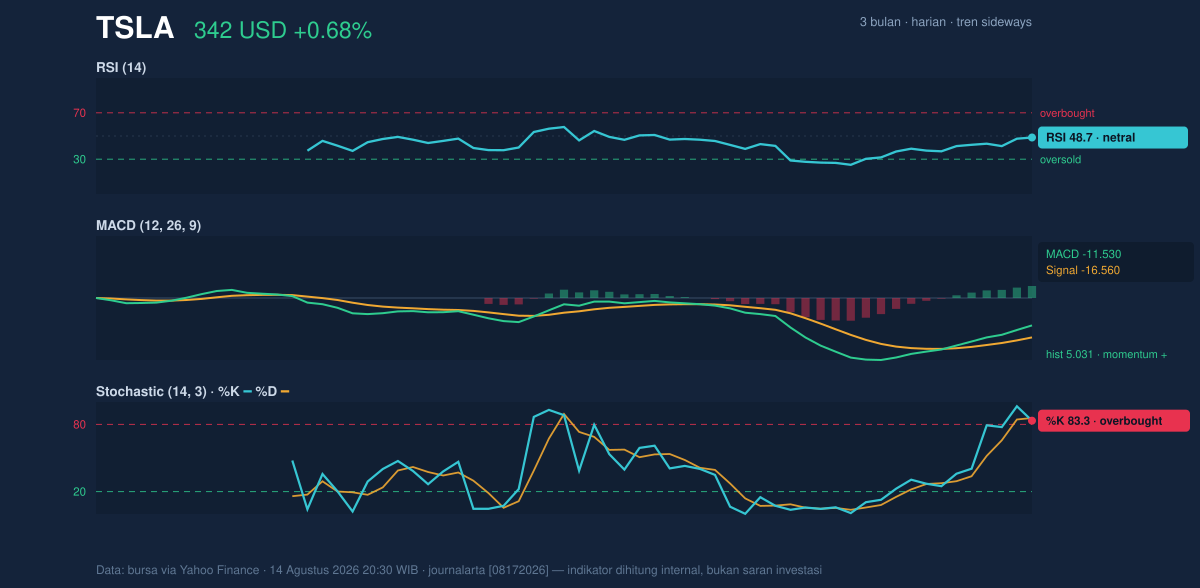
Momentum is mixed, and that mix explains why the stock can rise without yet looking fully healthy. The RSI at 48.7 is neutral, which means Tesla is neither overbought nor oversold on this measure. That matters because it suggests the stock still has some balance left; it is not extended enough to imply immediate exhaustion, but it is also not cheap enough to signal a strong contrarian rebound on momentum alone.
The Stochastic %K at 83.3 and %D at 85.7 are in overbought territory, which usually means the recent rise has been fast enough to leave price stretched in the short term. This does not automatically mean a drop is coming, but it does mean the stock may need to pause, consolidate, or pull back before it can extend higher. In other words, the oscillator is warning that the latest lift may be ahead of the broader trend.
The MACD at -11.530 remains below zero, yet the histogram at 5.031 is positive and the signal line at -16.560 is lower than the MACD line. That combination is constructive: it shows downside momentum is fading and the trend impulse is improving, even if the indicator has not fully crossed into outright bullish territory. For readers, this is the difference between “selling pressure is weakening” and “a new uptrend is already underway.” Tesla is closer to the first than the second.
Volatility & Volume
Volatility is elevated enough to keep price swings meaningful. The Bollinger bands are widening, with the band width at 26.5%, which signals expanding volatility rather than a tight squeeze. Expanding bands often appear when a stock is leaving a quiet phase and preparing for a larger move, but the direction still has to be confirmed by price. Since Tesla is trading at %B 65%, it is above the midline and leaning toward the upper half of the band, but not yet pressing the top band decisively.
The ATR at 11.20 — about 3.3% of price — suggests the stock is still capable of sizable daily moves. That means small breakouts can fail quickly, and small pullbacks can look dramatic without necessarily changing the broader setup. Volume helps here: last trade volume of 45,375,100 was about 1.1× normal, and OBV is rising. Rising OBV means volume is supporting the price recovery rather than contradicting it, a useful sign that buyers are participating rather than merely reacting.
Key Levels & Scenarios
The chart points to a clear decision zone. On the downside, 329.14 — the SMA20 and Bollinger middle band — is the first important pivot; losing it would weaken the short-term recovery and suggest the bounce is fading. Below that, 298.32 is the next major support, and a break there would expose the area near the 3 month low of 297.38. On the upside, 372.82 is the upper Bollinger band, and 378.93 is the more important resistance from the 20-hour range. A sustained move through that zone would be needed to argue that Tesla is moving from stabilization into a stronger trend phase.
The broader context is still mixed because the stock is well below the 3 month high of 445.60. That gap matters: it shows the market has not fully erased the earlier drawdown, and rallies are still being measured against a much higher prior peak. For now, the signal is one of improvement, not confirmation.
Technical Verdict: HOLD (wait & see)
HOLD (wait & see)
- RSI at 48.7 is neutral, so momentum is not strong enough to confirm a decisive trend.
- Stochastic is overbought at 83.3 / 85.7, which raises the odds of near-term cooling after the rebound.
- MACD histogram is positive at 5.031 and OBV is rising, which supports the bounce but does not yet override the still-sideways structure.
Verdict invalidated if price falls below 329.14, because that would mean Tesla has lost the short-term trend anchor and the recovery has weakened.
- Ideal Entry Range: 329.14 to 342.27
- Exit Target: 372.82 to 378.93
- Stop Loss protection: below 298.32
In plain English: Tesla is improving, but the chart still needs proof that the rebound can turn into a lasting advance.
Summary Data TSLA
| Last price | 342.27 USD |
| Change 1 day / 5 days / 1 month | 0.68% / 4.17% / -10.13% |
| Trend / MA-cross | sideways / none |
| SMA20 / SMA50 | 329.14 / 371.09 |
| RSI (14) / Stochastic %K | 48.7 / 83.3 |
| Bollinger %B / ATR | 65% / 11.20 |
| Support / Resistance 20 days | 298.32 / 378.93 |
| Data as of | 14 Agustus 2026 20:30 WIB |


