RSI Overbought, META Stock Gains 4.50% Today
On September 25, 2026: price 777.59 USD, trend uptrend, RSI 80.8, support 571.10, resistance 777.59. technical analysis of meta stock. RSI Overbought — full…

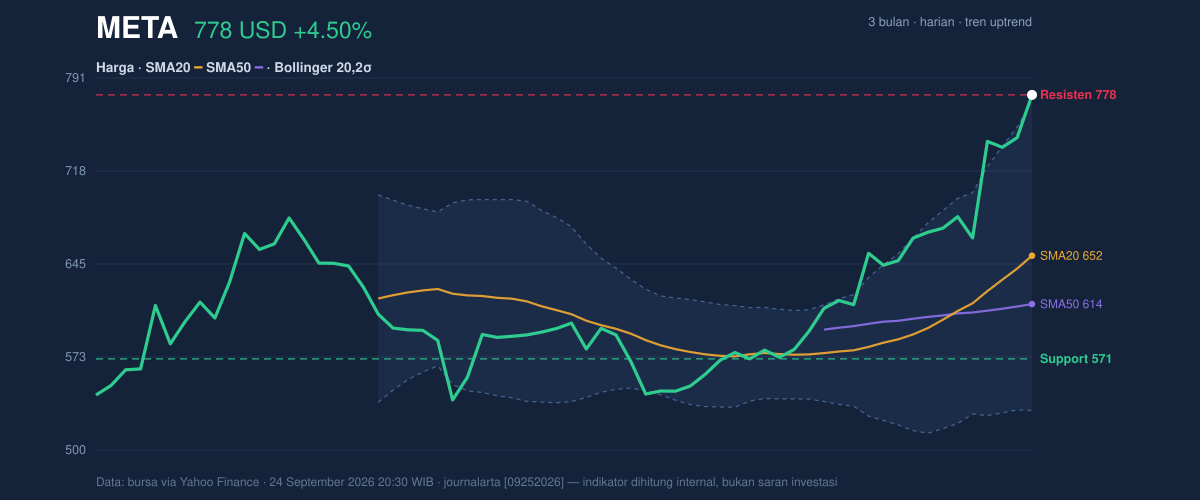
Meta Platforms closed at $777.59, up 4.50% on the day and 34.97% over the past month, as the stock pushed to the top of its recent trading range and came within a whisker of its 3-month high of $779.82. The move matters not just because it is large, but because it is broad: the price is sitting above both its SMA20 at $651.83 and SMA50 at $614.00, while volume rose to 34,744,400, or 1.6× the 20-day average. That combination says buyers are not merely marking time; they are forcing the stock into a higher zone, even as momentum readings warn the rally has become stretched.
Trend & Price Action
The chart shows a stock in a clear uptrend, with the SMA20 rising 7.10% over 5 days. That slope is important. A moving average that is rising quickly tells readers the recent buying pressure is persistent, not a one-day fluke. Meta is also trading well above its shorter and medium-term averages, which means the market is pricing the company above its recent consensus value rather than merely recovering from weakness.
What stands out is where the price sits inside the range. Meta is at 100% of its 20-hour range, with support at $571.10 and resistance at $777.59. In plain terms, the stock is not lingering in the middle of a channel; it is pressing directly against the ceiling. That often reflects strong demand, but it can also mean the easy part of the move has already happened. The lack of a fresh MA-cross is notable too. There is no new moving-average crossover to signal a change in trend structure, so this remains a continuation move rather than a brand-new technical regime.
Oscillators & Momentum
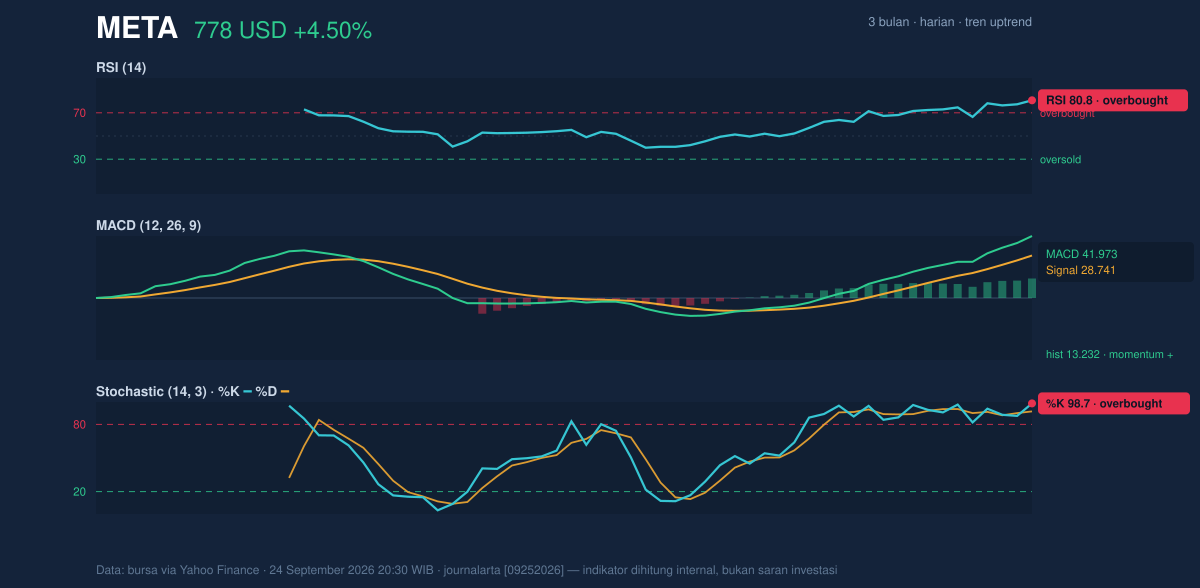
The momentum picture is powerful, but also overheated. Meta’s RSI at 80.8 and Stochastic %K at 98.7 / %D at 91.6 both sit in overbought territory. For general readers, that does not mean the stock must fall immediately. It means the pace of buying has been fast enough that the stock may be vulnerable to pauses, pullbacks, or sideways consolidation as traders lock in gains. When both oscillators are this elevated, the market is often telling you enthusiasm is high, but so is short-term exhaustion risk.
That warning is partly offset by the MACD at 41.973 versus its signal line at 28.741, with a 13.232 histogram. MACD is still positive and expanding, which means trend momentum remains intact. In other words, the stock is not yet showing the kind of momentum failure that usually precedes a deeper reversal. The message from the oscillators is mixed but clear: the trend is still strong, yet it is running hot.
Volatility & Volume
Volatility is rising alongside price. Meta’s Bollinger Bands are widening, with the upper band at $772.85, the middle band at $651.83, and the lower band at $530.82. The stock is trading at 102% of %B, which means it is moving slightly beyond the upper band. That is a classic sign of strength, but it also shows the price has stretched outside the statistical envelope that often contains normal trading. The 37.1% band width confirms the expansion in volatility, and the ATR(14) at 28.24, equal to 3.6% of price, says daily swings are likely to stay large.
Volume supports the breakout attempt. The latest turnover of 34,744,400 shares is well above the 22,398,065 average, and OBV is rising. That matters because price gains backed by heavier participation are more credible than gains made on thin trading. OBV, or on-balance volume, is a simple way of tracking whether money flow is confirming the trend. Here, it is. The market is not just drifting upward; it is being pushed there by active participation.
Key Levels & Scenarios
The immediate technical map is tight. Meta is already sitting on its 20-hour resistance at $777.59, while the next reference point from the data is the 3-month high at $779.82. A clean move above that area would leave the stock in fresh high ground, where price discovery can accelerate because there is little prior trading history to act as a guide. On the downside, the most visible nearby support is the 20-hour support at $571.10, with the SMA20 at $651.83 and middle Bollinger band at $651.83 sitting much higher than that floor, showing how far the stock has already moved from its base.
The practical interpretation is straightforward. If Meta holds above the upper band and keeps volume elevated, the market is signaling confidence that the trend can extend. If it fails to hold the current breakout zone, the first thing to watch is whether momentum cools without damaging the broader uptrend. A retreat toward the $651.83 area would not automatically break the structure, but it would show the rally is transitioning from acceleration to digestion.
Technical Verdict: HOLD (wait & see)
HOLD (wait & see)
RSI at 80.8 and Stochastic at 98.7 / 91.6 show the stock is stretched, even though MACD remains strongly positive and volume is confirming the move. The price is also pressing against the upper Bollinger band at $772.85 and the 3-month high at $779.82, so the setup is strong but not clean enough to ignore exhaustion risk. The verdict is invalidated if price falls below $651.83, which would mean the stock has lost the middle Bollinger/SMA20 zone that is currently supporting the trend.
- Ideal Entry Range: $651.83 to $672.00, using the SMA20 / middle Bollinger area as the first pullback zone
- Exit Target: $779.82, with any decisive move above that level signaling fresh high ground
- Stop Loss protection: below $571.10, the 20-hour support level
For non-traders, this means Meta looks strong, but the stock is already running hot enough that patience may matter more than urgency.
Summary Data META
| Last price | 777.59 USD |
| Change 1 day / 5 days / 1 month | 4.50% / 13.96% / 34.97% |
| Trend / MA-cross | uptrend / none |
| SMA20 / SMA50 | 651.83 / 614.00 |
| RSI (14) / Stochastic %K | 80.8 / 98.7 |
| Bollinger %B / ATR | 102% / 28.24 |
| Support / Resistance 20 days | 571.10 / 777.59 |
| Data as of | 24 September 2026 20:30 WIB |

