Alibaba Stock Gains 2.66%, Momentum Gains In Focus
On October 6, 2026: price 108.20 HKD, trend sideways, RSI 47.9, support 104.40, resistance 114.80. technical analysis of alibaba stock.
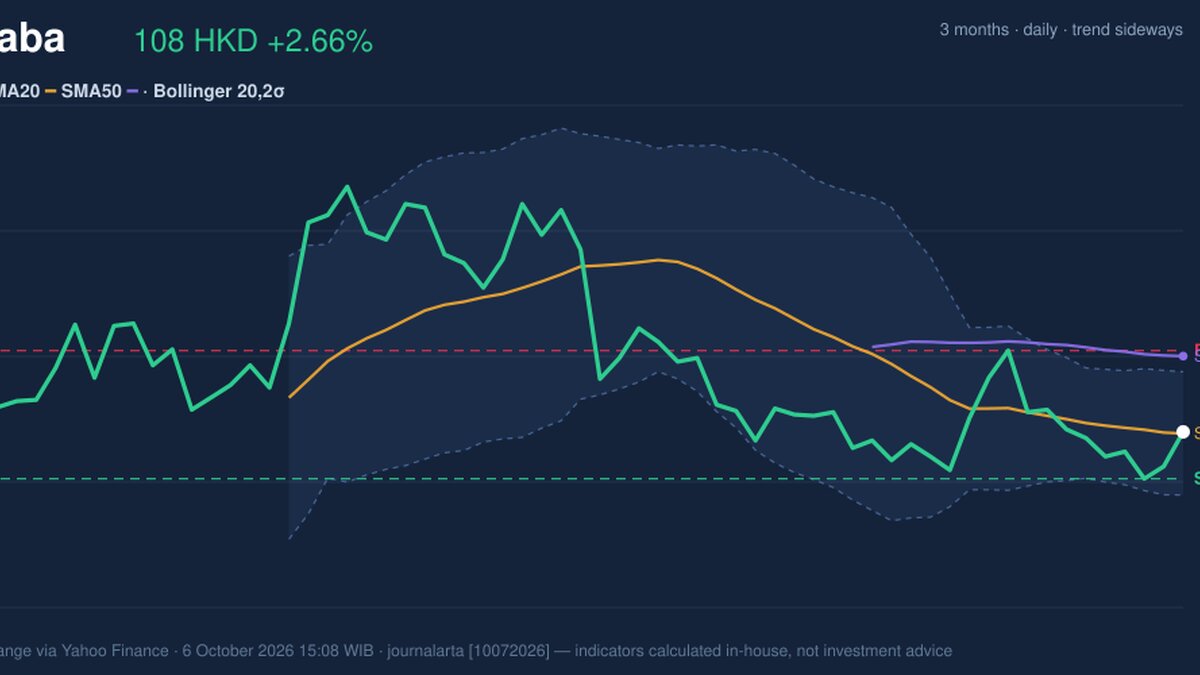
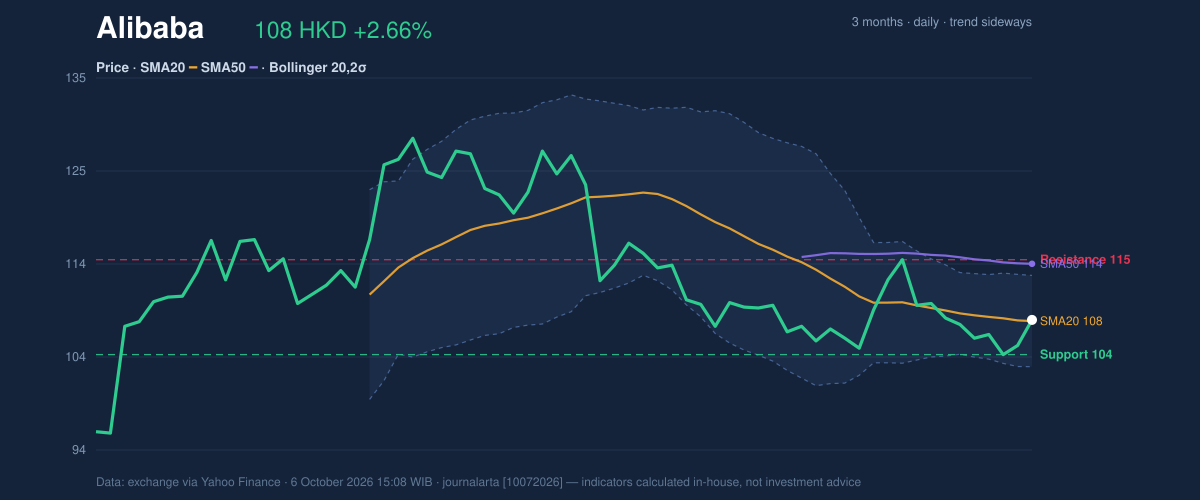
Alibaba Group traded at HK$108.20 on the Hong Kong Stock Exchange on October 6, up 2.66% from the previous close, but the rebound came on thin volume and left the shares within a broader sideways pattern. The price is just above its 20-day average, while remaining below its 50-day average—a mixed technical picture that points to short-term stabilisation, not a confirmed change in trend.
Trend & Price Action
Alibaba’s shares have gained 0.46% over five trading days but are down 1.28% over one month. The 20-day simple moving average (SMA), which smooths recent prices, is HK$108.08; the 50-day SMA is HK$114.35. Trading just above the shorter average suggests the latest price has held near its recent baseline. Its position below the longer average, however, shows that the broader trend has yet to strengthen.
The 20-day average is sloping down by 0.77% over five days, and there has been no new crossing between the averages. A “golden cross”—when a shorter-term average moves above a longer-term one—would offer a stronger trend signal, but that has not occurred. The shares sit 37% of the way through their recent support-to-resistance range, closer to support than resistance.
The price is holding its short-term average, but the declining slope and lower 50-day average keep the trend sideways rather than decisively bullish.
The Bollinger middle band, another measure based on the 20-day average, is HK$108.08, with the upper and lower bands at HK$113.08 and HK$103.07. At 51% of the band’s width, the price is near the middle, not pressing either boundary. The band width is 9.3%, described as normal, so the data do not point to an unusually compressed or expanded trading range.
Oscillators & Momentum
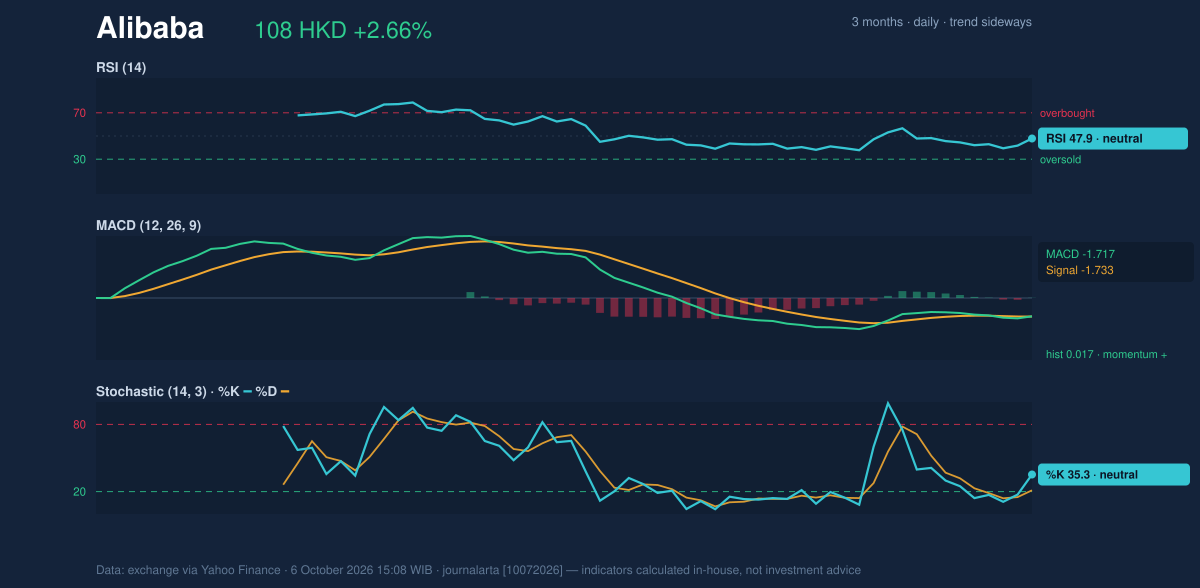
Momentum readings lean slightly positive but lack strong confirmation. The relative strength index (RSI), which gauges the speed of recent price moves, is 47.9, a neutral reading. The stochastic oscillator is also classified as neutral, with %K at 35.3 and %D at 21.2. Neither measure signals an extreme condition in the supplied data.
The moving average convergence divergence indicator (MACD), used to assess momentum and trend, remains below zero at -1.717, but is marginally above its -1.733 signal line. Its histogram is positive at 0.017. That combination suggests momentum has edged upward, even though it has not yet shifted into positive territory. It is a tentative improvement, rather than evidence on its own of a durable reversal.
MACD’s positive histogram is the clearest near-term improvement, while neutral RSI and stochastic readings leave the broader momentum signal unconfirmed.
Volatility, Volume & Key Levels
The average true range (ATR), a measure of typical price movement, is HK$3.46, or 3.2% of the share price, indicating moderate volatility. That matters because a move of several Hong Kong dollars can occur within ordinary trading conditions; a brief test of a level is not automatically a lasting break.
Volume was 31.5 million shares, about 0.6 times the 20-trading-day average of 53.0 million. The day’s gain therefore lacked broad participation by the standards of recent trading. On-balance volume (OBV), which tracks buying and selling pressure through volume, is rising—a constructive counter-signal, though it does not erase the thin turnover.
The nearest supplied support is HK$104.40, while resistance is HK$114.80. A sustained move through resistance would challenge the current sideways structure; failure to hold support would weaken the case that the latest stabilisation is intact. The three-month high and low are HK$130.30 and HK$92.50, respectively, showing that the present price remains within a wider range.
Technical Verdict: HOLD (wait & see)
HOLD (wait & see) is the clearest reading of the mixed indicators: the price is above the 20-day average, MACD’s histogram has turned marginally positive, and OBV is rising. Against that, the 50-day average remains overhead, its shorter-term counterpart is sloping down, and the latest rise came on thin volume.
The verdict is invalidated if the price falls below HK$104.40, the stated support level.
- Ideal Entry Range: HK$104.40–HK$108.08, spanning support and the 20-day average.
- Exit Target (Target Price): HK$114.80, the stated resistance.
- Stop Loss: Below HK$103.07, the lower Bollinger band.
In plain English, the indicators show early stabilisation but not enough confirmation to establish a stronger upward trend.
Data
Source: Hong Kong exchange data via Yahoo Finance, as of October 6, 2026, 15:08 WIB. Prices and technical indicators are based on the supplied market data; this analysis is technical commentary, not an investment recommendation.
Summary Data Alibaba
| Last price | 108.20 HKD |
| Change 1 day / 5 days / 1 month | 2.66% / 0.46% / -1.28% |
| Trend / MA-cross | sideways / none |
| SMA20 / SMA50 | 108.08 / 114.35 |
| RSI (14) / Stochastic %K | 47.9 / 35.3 |
| Bollinger %B / ATR | 51% / 3.46 |
| Support / Resistance 20 days | 104.40 / 114.80 |
| Data as of | 6 October 2026 15:08 WIB |
Track Alibaba share price daily: live levels, support/resistance and our full Alibaba analysis history.