RELX Stock Analysis: Drops 1.53%, Momentum Weakens
On November 3, 2026: price 2,952.00 GBp, trend uptrend, RSI 62.1, support 2,595.00, resistance 3,039.00. technical analysis of relx stock.

Trend & Price Action
The latest close was below the previous close of 2,998.00 GBp, but RELX was still up 0.44% over five days and 14.82% over one month. That contrast points to a short-term pause inside a stronger recent advance, rather than a confirmed reversal. The 20-day simple moving average (SMA) rose 3.80% over five days, while the share price remained above both the 20-day average at 2,880.50 GBp and the 50-day average at 2,682.78 GBp. There was no new moving-average crossover. The price is about 80% of the way through its 20-day range, between support at 2,595.00 GBp and resistance at 3,039.00 GBp. It is also approaching, but remains below, the three-month high of 3,053.00 GBp. As shown in the chart, the rising averages support the prevailing uptrend, while the nearby resistance levels mark the area where that advance is now being tested.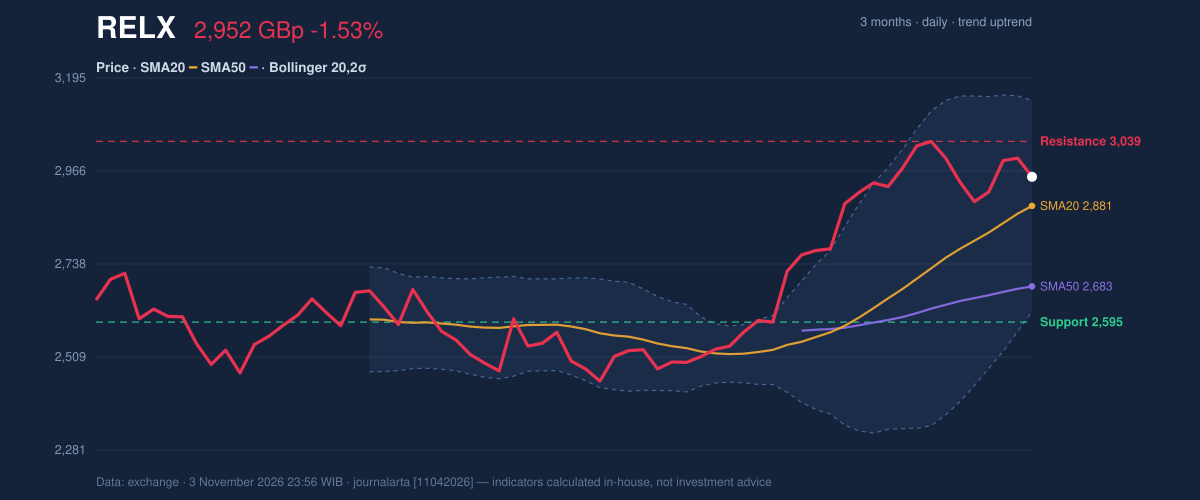
Oscillators & Momentum
The MACD, a measure of trend momentum, is the clearest caution signal: its value of 93.601 is below the 97.826 signal line, leaving a histogram of -4.225. The histogram has just turned negative, meaning momentum has weakened relative to the signal line; it does not by itself establish that the price trend has reversed. Other momentum readings are less decisive. RSI is 62.1, in neutral territory, while the Stochastic readings are %K 60.7 and %D 74.5, also neutral. The technical-bias assessment notes that RSI has rolled over from above 65. Together, that softening and the negative MACD histogram temper the bullish price structure, but do not outweigh it conclusively.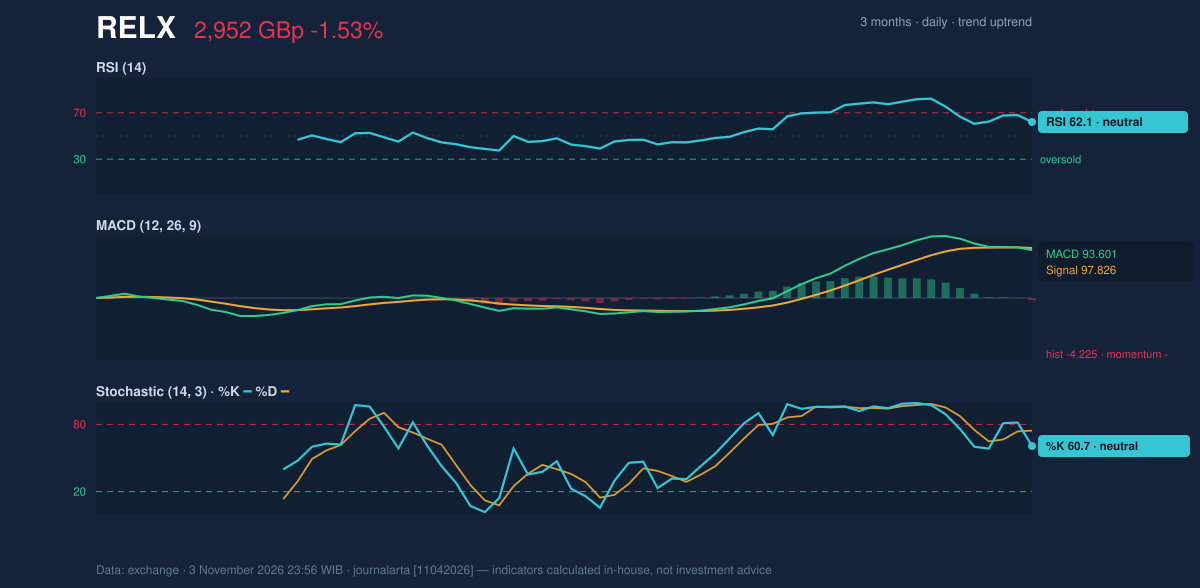
Volatility & Volume
RELX’s Bollinger Bands, which frame typical price variation around a moving average, have a normal width of 18.0%. The close sits at 64% of the band’s range, below the upper band at 3,139.76 GBp and above the middle band at 2,880.50 GBp. That position shows the share is not pressed against the upper boundary, though it is still trading in the upper half of its recent volatility range. Average True Range (ATR), a measure of typical daily movement, is 81.55 GBp, or 2.8% of the share price, indicating moderate volatility. Trading volume was 2,307,776 shares, about 0.6 times the 20-day average of 3,936,197. That thin activity makes the latest pullback a less forceful signal of broad selling pressure; rising On-Balance Volume (OBV), which tracks whether volume is flowing more with advances or declines, also supports the underlying uptrend.Key Levels & Scenarios
A sustained move above 3,039.00 GBp would clear 20-day resistance and put the three-month high at 3,053.00 GBp in focus. Failure to hold the 20-day average at 2,880.50 GBp would weaken the near-term structure; the data-based volatility reference at 2,829.68 GBp, equal to the latest price minus 1.5 times ATR, provides a further downside marker. The broader 20-day support remains 2,595.00 GBp.Technical Verdict: HOLD
The neutral technical bias calls for a wait-and-see reading rather than a directional signal. The strongest reasons are the negative MACD histogram of -4.225 and the RSI rollover from above 65, balanced by the share price remaining above both moving averages and OBV rising. The verdict is invalidated if the price falls below 2,595.00 GBp, the 20-day support.- Illustrative entry range: 2,880.50–3,039.00 GBp, bounded by the 20-day average and 20-day resistance.
- Illustrative exit target: 3,053.00 GBp, the three-month high beyond 20-day resistance.
- Illustrative stop-loss protection: 2,829.68 GBp, the price-minus-1.5×ATR reference.
RELX’s 20-day resistance is 3,039.00 GBp.
Why RELX is in focus today
- MACD histogram has just turned negative
Selected automatically from 98 LSE (UK) stocks by a technical-signal score with daily weighted randomisation — not a recommendation.
Summary Data RELX
| Last price | 2,952.00 GBp |
| Change 1 day / 5 days / 1 month | -1.53% / 0.44% / 14.82% |
| Trend / MA-cross | uptrend / none |
| SMA20 / SMA50 | 2,880.50 / 2,682.78 |
| RSI (14) / Stochastic %K | 62.1 / 60.7 |
| Bollinger %B / ATR | 64% / 81.55 |
| Support / Resistance 20 days | 2,595.00 / 3,039.00 |
| Data as of | 3 November 2026 23:56 WIB |
Disclaimer: This technical analysis is generated automatically from exchange data and indicators calculated by JournalArta, for information and education only. The verdict and the entry, target and stop-loss levels are not investment advice or a solicitation to buy or sell any security. Investment decisions and their risks rest solely with the reader.
Track RELX share price daily: live levels, support/resistance and our full RELX analysis history.