Keppel RSI Oversold: Stock Drops 1.99% (November 3, 2026)
On November 3, 2026: price 9.85 SGD, trend downtrend, RSI 27.3, support 9.85, resistance 11.02. technical analysis of keppel stock. Keppel RSI Oversold — full…
Why Keppel is in focus today
- Closed at a 20-day low (9.85)
- Trading near its 3-month low (9.77)
- RSI(14) at 27.3 — oversold zone
- Downtrend extending (5-day change -2.48%)
Selected automatically from 32 SGX (Singapore) stocks by a technical-signal score with daily weighted randomisation — not a recommendation.
Trend & Price Action
The share price has lost 10.21% over one month and sits at the bottom of its 20-day range, with support at S$9.85 and resistance at S$11.02. It is also close to the three-month low of S$9.77. This location matters: a nearby floor can attract buyers, but a close at the range low also shows that sellers have kept control into the latest session. The Bollinger reading places the price near the lower band. With the lower band at S$9.72 and %B at 13%, Keppel is trading close to the low end of its recent price envelope. The band width is 9.9%, described as normal rather than unusually compressed or expanded. That points to weakness within an ordinary volatility range—not, by itself, a signal that a sharp reversal is due. As shown in the chart, the gap between the current price and the moving averages highlights the pressure on the trend, while the nearby support and lower Bollinger band show where the price is testing its recent floor.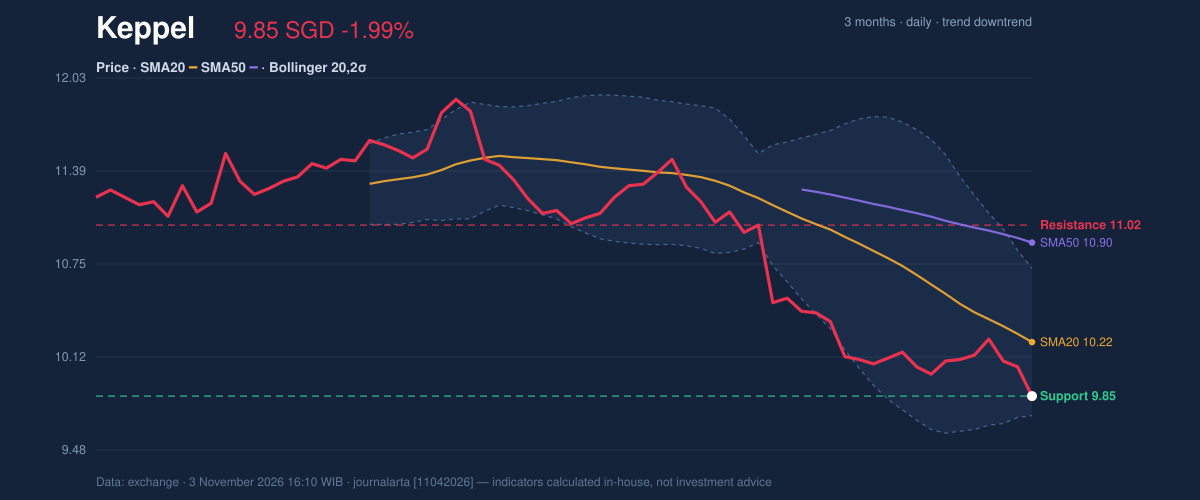
Oscillators & Momentum
RSI at 27.3 and Stochastic readings of 11.9 (%K) and 19.7 (%D) are both in oversold territory. These indicators describe how far and how quickly a price has fallen; they can flag stretched selling, but they do not establish that a bottom is in place. The distinction is important when the trend is still down. MACD presents a limited counter-signal. Its value is -0.257, below zero, while the histogram is positive at 0.013 and the MACD reading is slightly above its -0.270 signal line. That indicates momentum has improved at the margin, but remains negative in absolute terms. It is an early sign of easing downward pressure, not confirmation of an uptrend. The chart brings those signals together: deeply oversold RSI and Stochastic readings sit alongside a MACD histogram that has turned positive, leaving momentum mixed rather than decisively bullish.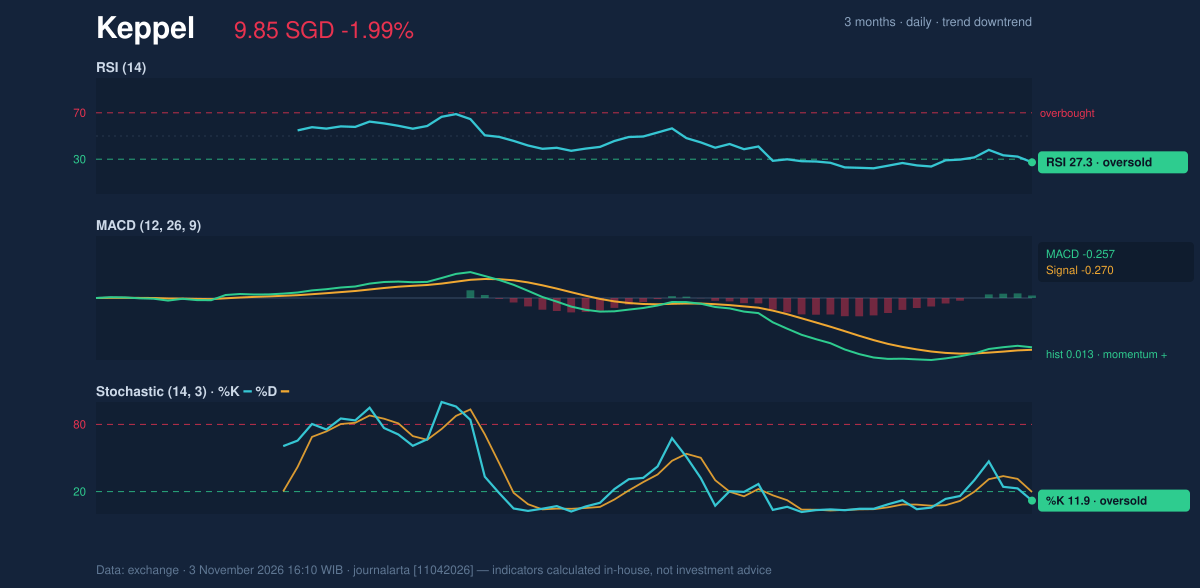
Volatility, Volume & Key Levels
Trading volume reached 4,677,770 shares, or 1.3 times its 20-session average of 3,732,520. Higher activity alongside a decline suggests the move drew more participation than usual. OBV, a measure that tracks whether volume is flowing more with rising or falling prices, is also down. That supports the bearish trend reading: the oversold oscillators have not yet been matched by evidence of improving buying pressure. Average true range is S$0.20, equivalent to 2.0% of the share price, indicating moderate volatility. The reference move of 1.5 times ATR below the latest price is S$9.56; above it, S$10.14. These are volatility-based reference levels, not forecasts. The key near-term test remains whether Keppel can hold the S$9.85 20-day support, with S$9.77 marking the three-month low. A break below those levels would deepen the price damage; a recovery would first need to reclaim the S$10.22 20-day average, with S$11.02 the 20-day resistance. The technical bias is neutral, with no bullish signals among the seven assessed and one bearish signal: the downtrend confirmed by falling OBV. Oversold readings and the positive MACD histogram temper, but do not overturn, that assessment.Technical Verdict: HOLD (wait & see)
HOLD (wait & see) matches the neutral technical bias: the stock is oversold, but the falling trend and OBV argue against treating that condition as a confirmed reversal. - Ideal entry range: S$9.77–S$9.85, around the three-month low and 20-day support; this is a technical reference range, not a recommendation. - Exit target (target price): S$11.02, the 20-day resistance. - Stop-loss protection: S$9.56, the price minus 1.5 times ATR. - Invalidation: The hold assessment is invalidated if the price breaks below S$9.56, indicating a move beyond the stated volatility reference. For non-traders, the signals say Keppel is under pressure and stretched to the downside, but there is not yet enough confirmation that the decline has reversed.Data Table
| Indicator | Reading |
|---|---|
| Latest price | S$9.85 |
| Daily / five-day / one-month change | -1.99% / -2.48% / -10.21% |
| SMA20 / SMA50 | S$10.22 / S$10.90 |
| RSI(14) | 27.3 — oversold |
| Stochastic %K / %D | 11.9 / 19.7 — oversold |
| MACD / signal / histogram | -0.257 / -0.270 / 0.013 |
| Support / resistance (20 sessions) | S$9.85 / S$11.02 |
| Three-month high / low | S$11.91 / S$9.77 |
| ATR(14) | S$0.20 (2.0%) |
| Volume / 20-session average | 4,677,770 / 3,732,520 |
Summary Data Keppel
| Last price | 9.85 SGD |
| Change 1 day / 5 days / 1 month | -1.99% / -2.48% / -10.21% |
| Trend / MA-cross | downtrend / none |
| SMA20 / SMA50 | 10.22 / 10.90 |
| RSI (14) / Stochastic %K | 27.3 / 11.9 |
| Bollinger %B / ATR | 13% / 0.20 |
| Support / Resistance 20 days | 9.85 / 11.02 |
| Data as of | 3 November 2026 16:10 WIB |
Disclaimer: This technical analysis is generated automatically from exchange data and indicators calculated by JournalArta, for information and education only. The verdict and the entry, target and stop-loss levels are not investment advice or a solicitation to buy or sell any security. Investment decisions and their risks rest solely with the reader.
Track Keppel share price daily: live levels, support/resistance and our full Keppel analysis history.