ANTA Testing Key Resistance: Stock Gains 3.65% (November 3, 2026)
On November 3, 2026: price 78.15 HKD, trend sideways, RSI 61.7, support 71.10, resistance 78.15. technical analysis of anta stock. ANTA Testing Key Resistance…
Why ANTA is in focus today
- Closed at a 20-day high (78.15)
Selected automatically from 72 HKEX (Hong Kong) stocks by a technical-signal score with daily weighted randomisation — not a recommendation.
Trend & Price Action
ANTA gained 8.47% over five sessions and 6.69% over one month. The advance has brought the price above its 20-day simple moving average (SMA), at HK$73.75, while the 50-day average sits at HK$73.92. The averages are close, but the data show no new moving-average crossover; the broader trend remains sideways. The 20-day average rose 0.31% over five days, a modest slope that points to gradual improvement rather than a decisive trend shift. The close matched the HK$78.15 20-day resistance and reached 100% of the reported 20-session range. It also sits just below the three-month high of HK$80.75. That proximity matters: a close at a range ceiling shows strength, but the next test is whether buyers can sustain the move beyond resistance. The price is pressing against resistance, not yet establishing a confirmed breakout. The Bollinger upper band, a measure of the upper boundary of recent price variation, is HK$78.03. At 101% of the band, the close is slightly above it, a sign that the move has stretched beyond its recent statistical range. Band width is 11.6%, described as normal, so the data do not point to an unusually tight setup poised for a volatility surge.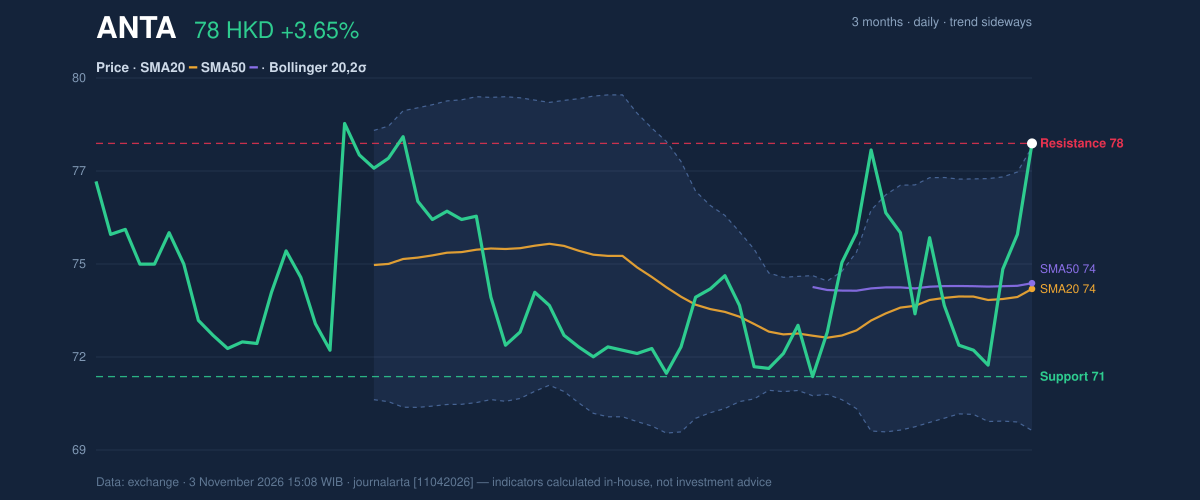
Oscillators & Momentum
The momentum indicators are not fully aligned. The 14-day Relative Strength Index (RSI), which gauges the pace of recent gains and losses, is 61.7, in neutral territory. The Stochastic oscillator, which compares the latest close with its recent range, is more extended: %K at 92.2 and %D at 66.4 signal overbought conditions. That does not prove a reversal, but it suggests the stock may need sustained buying to keep advancing without a pause. The MACD histogram, a measure of the gap between two trend-following averages, is positive at 0.307, with MACD at 0.429 and its signal line at 0.122. This supports near-term upward momentum. Yet the technical-bias calculation remains neutral, with only one of seven bullish signals—the histogram turning positive—and no bearish signals. In plain terms, momentum has improved, but the evidence is not broad enough to call the trend bullish.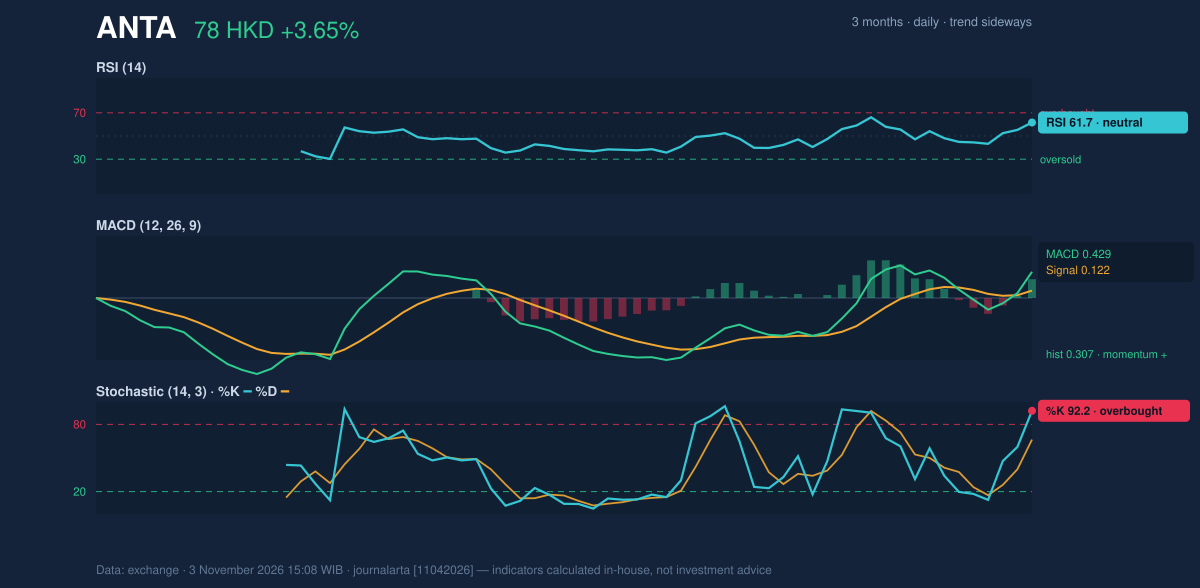
Volatility, Volume & Levels
Trading volume was 11,348,375 shares, about 1.1 times the 20-session average of 10,431,751. That is above normal, but not a large expansion in participation. On-balance volume (OBV), which tracks whether volume tends to accompany rising or falling prices, was down. The divergence means the closing high is not yet reinforced by a clear accumulation signal. Average True Range (ATR), a measure of typical daily price movement, was HK$2.71, or 3.5% of the share price—moderate volatility. The nearest reference levels are HK$78.15 resistance and HK$71.10 support; the three-month range extends from HK$70.30 to HK$80.75. A sustained move above the 20-day ceiling would put the three-month high in view, while a failure to hold above the moving averages would shift attention to support.Technical Verdict: HOLD (wait & see)
The neutral verdict reflects a test of resistance without broad technical confirmation. The MACD histogram is positive, but the Stochastic is overbought and OBV is falling; meanwhile, the price is at the 20-day ceiling and just above the Bollinger upper band. The verdict is invalidated if the price falls below HK$71.10, the 20-day support.- Ideal entry range: HK$73.75–HK$78.15, bounded by the 20-day average and 20-day resistance.
- Exit target: HK$80.75, the three-month high and next reference level above resistance.
- Stop-loss protection: HK$71.10, the 20-day support.
Summary Data ANTA
| Last price | 78.15 HKD |
| Change 1 day / 5 days / 1 month | 3.65% / 8.47% / 6.69% |
| Trend / MA-cross | sideways / none |
| SMA20 / SMA50 | 73.75 / 73.92 |
| RSI (14) / Stochastic %K | 61.7 / 92.2 |
| Bollinger %B / ATR | 101% / 2.71 |
| Support / Resistance 20 days | 71.10 / 78.15 |
| Data as of | 3 November 2026 15:08 WIB |
Disclaimer: This technical analysis is generated automatically from exchange data and indicators calculated by JournalArta, for information and education only. The verdict and the entry, target and stop-loss levels are not investment advice or a solicitation to buy or sell any security. Investment decisions and their risks rest solely with the reader.
Track ANTA share price daily: live levels, support/resistance and our full ANTA analysis history.