Testing Key Resistance, JD.com Stock Gains 5.61% on Tuesday
On November 3, 2026: price 107.30 HKD, trend sideways, RSI 57.9, support 98.30, resistance 108.50. technical analysis of jd.com stock. Testing Key Resistance —…

Why JD.com is in focus today
- One-day move of 5.61%, about 2.0× its average daily range (ATR)
- Volume at 2.3× the 20-day average
- MACD histogram has just turned positive
Selected automatically from 72 HKEX (Hong Kong) stocks by a technical-signal score with daily weighted randomisation — not a recommendation.
Trend & Price Action
The day’s advance outpaced the stock’s 2.8% average true range, a measure of typical daily movement, and came with rising on-balance volume (OBV), which tracks whether trading volume is flowing with price gains or losses. Together, the indicators show that the rally had meaningful participation rather than being a price move on thin trading. They do not, by themselves, establish that the advance has changed the underlying trend. JD.com traded above its 20-day moving average of HK$103.08 but remained in a sideways trend; that average’s slope was down 0.45% over five days. The stock also stood above its 50-day moving average of HK$105.57, but there was no new moving-average crossover. A crossover occurs when a shorter-term average moves through a longer-term one and can signal a shift in trend; its absence means the latest surge has not yet supplied that confirmation. At HK$107.30, the shares were near the upper end of their 20-day trading range, with resistance at HK$108.50. The 20-day support is HK$98.30; the three-month low and high are HK$97.40 and HK$130.90, respectively. The upper Bollinger Band, a volatility-based range around the moving average, was at HK$109.23, putting the price close to that boundary. The bands’ 11.9% width was normal, not unusually narrow or wide. As shown in the chart, price is pressing toward near-term resistance while remaining above both moving averages.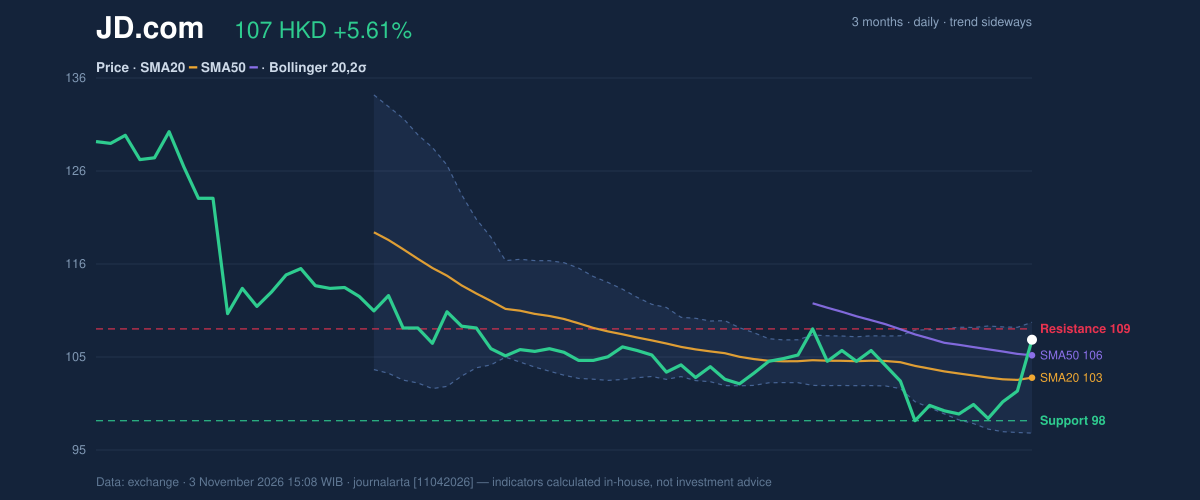
Oscillators & Momentum
The momentum readings are mixed rather than uniformly bullish. The RSI was 57.9, a neutral reading, indicating neither an especially strong nor an unusually weak pace of gains. By contrast, the stochastic %K was 90.8, above the %D at 51.8, a configuration associated with overbought short-term conditions. That does not guarantee a reversal, but it suggests the rapid advance may be vulnerable to a pause, particularly near resistance. The MACD histogram turned positive at 0.498, with MACD at -1.292 and its signal line at -1.790. The positive histogram means momentum has improved relative to the signal line; it is the clearest bullish change in the indicators, but it is not yet enough to override the neutral trend assessment. The chart shows how the momentum signals diverge: MACD has improved, while the high stochastic reading points to near-term stretch.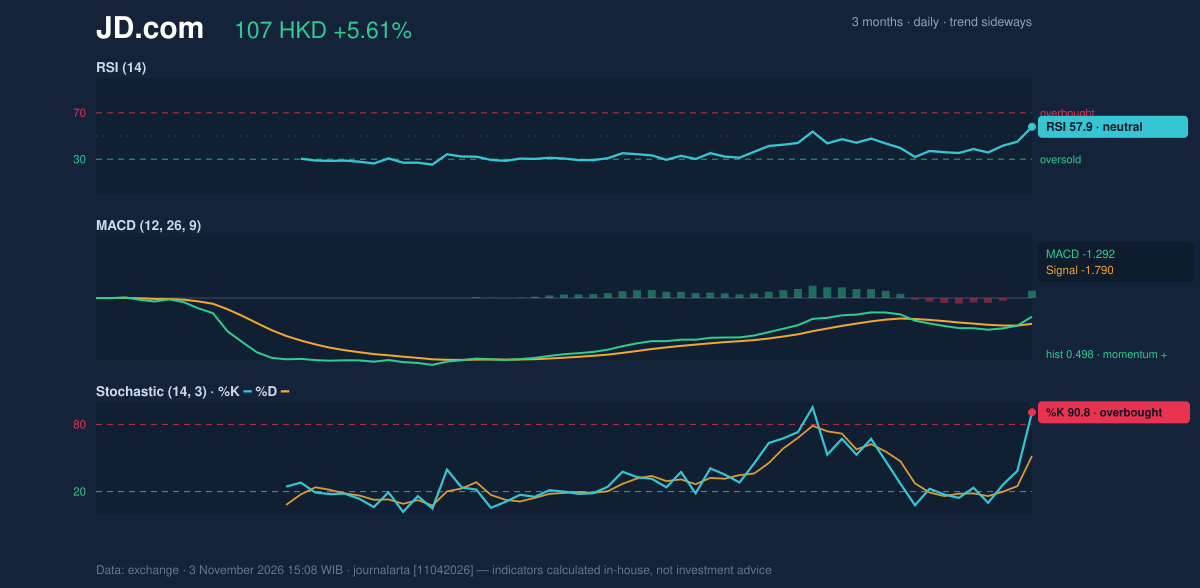
Volatility, Volume & Scenarios
Volume of 17,236,091 shares was 2.3 times the 20-day average of 7,504,209, while OBV rose. That combination supports the view that buyers participated in the move. Still, a single high-volume session cannot establish whether demand will persist. The 14-day ATR was HK$3.04, or 2.8% of the share price, indicating moderate volatility. A move above HK$108.50 would clear the stated 20-day resistance; the next reference is the three-month high at HK$130.90. If the shares fail to hold above near-term support, HK$98.30 is the key 20-day level to watch, with the three-month low at HK$97.40. These are conditional reference points, not assured outcomes.Technical Verdict: HOLD
The neutral bias supports a wait-and-see verdict. The strongest evidence is the sideways trend and declining 20-day average slope, alongside the absence of a new moving-average crossover. The positive MACD histogram and volume-backed rise are constructive, but the overbought stochastic cautions against treating one strong session as confirmed trend change. - Ideal entry range: HK$103.08–HK$108.50, between the 20-day average and 20-day resistance. - Exit target: HK$108.50, the 20-day resistance; a move above it would put the three-month high at HK$130.90 in view. - Stop-loss protection: HK$98.30, the 20-day support. The verdict is invalidated if the price falls below HK$98.30. In plain English, the indicators do not yet agree on whether the sharp rise marks a lasting change in direction. JD.com shares closed the cited session at HK$107.30.| Indicator | Reading |
|---|---|
| Session change | +5.61% |
| Five-day change | +8.33% |
| One-month change | +4.79% |
| 20-day / 50-day moving average | HK$103.08 / HK$105.57 |
| Bollinger Bands (upper / middle / lower) | HK$109.23 / HK$103.08 / HK$96.93 |
| ATR (14) | HK$3.04 |
| Volume / 20-day average | 17,236,091 / 7,504,209 |
| 20-day support / resistance | HK$98.30 / HK$108.50 |
| Three-month low / high | HK$97.40 / HK$130.90 |
Summary Data JD.com
| Last price | 107.30 HKD |
| Change 1 day / 5 days / 1 month | 5.61% / 8.33% / 4.79% |
| Trend / MA-cross | sideways / none |
| SMA20 / SMA50 | 103.08 / 105.57 |
| RSI (14) / Stochastic %K | 57.9 / 90.8 |
| Bollinger %B / ATR | 84% / 3.04 |
| Support / Resistance 20 days | 98.30 / 108.50 |
| Data as of | 3 November 2026 15:08 WIB |
Disclaimer: This technical analysis is generated automatically from exchange data and indicators calculated by JournalArta, for information and education only. The verdict and the entry, target and stop-loss levels are not investment advice or a solicitation to buy or sell any security. Investment decisions and their risks rest solely with the reader.
Track JD.com share price daily: live levels, support/resistance and our full JD.com analysis history.