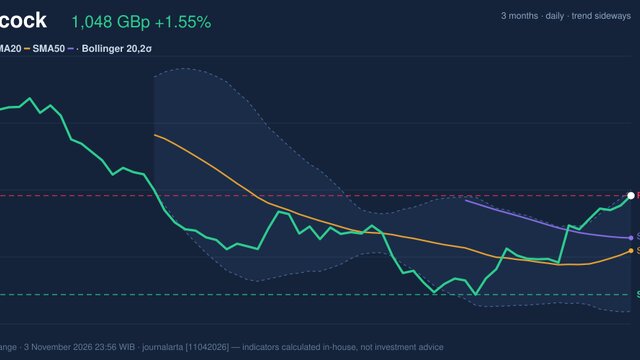
Glencore Stock Drops 2.83%, RSI Oversold In Focus
On November 3, 2026: price 504.30 GBp, trend downtrend, RSI 27.1, support 504.30, resistance 586.30. technical analysis of glencore stock.

Why Glencore is in focus today
- Closed at a 20-day low (504.30)
- Trading near its 3-month low (504.30)
- RSI(14) at 27.1 — oversold zone
- Downtrend extending (5-day change -6.92%)
Selected automatically from 98 LSE (UK) stocks by a technical-signal score with daily weighted randomisation — not a recommendation.
Trend & Price Action
The shares dropped 2.83% in one day, 6.92% over five days and 12.07% over one month, according to the market data for the session. They closed below the 20-day moving average of 553.22 pence and the 50-day average of 569.07 pence. Both averages sit above the price, a pattern consistent with a downtrend rather than a confirmed recovery. The 20-day average itself fell 1.66% over five days. No new moving-average crossover was recorded, so there is no fresh technical signal from the relationship between the two averages. Instead, the more immediate pressure is clear: the close matched the 20-day support and the three-month low, leaving the shares at 0% of their stated 20-day range. The three-month high is 669.30 pence. The lower Bollinger Band, a measure of price movement around its recent average, stands at 505.10 pence. Glencore’s close was slightly below it, with %B at -1%. That indicates an unusually weak position relative to the band, though an overshoot can persist in a falling market rather than automatically marking a floor. As shown in the chart, the price is below both moving averages and near the lower band and support.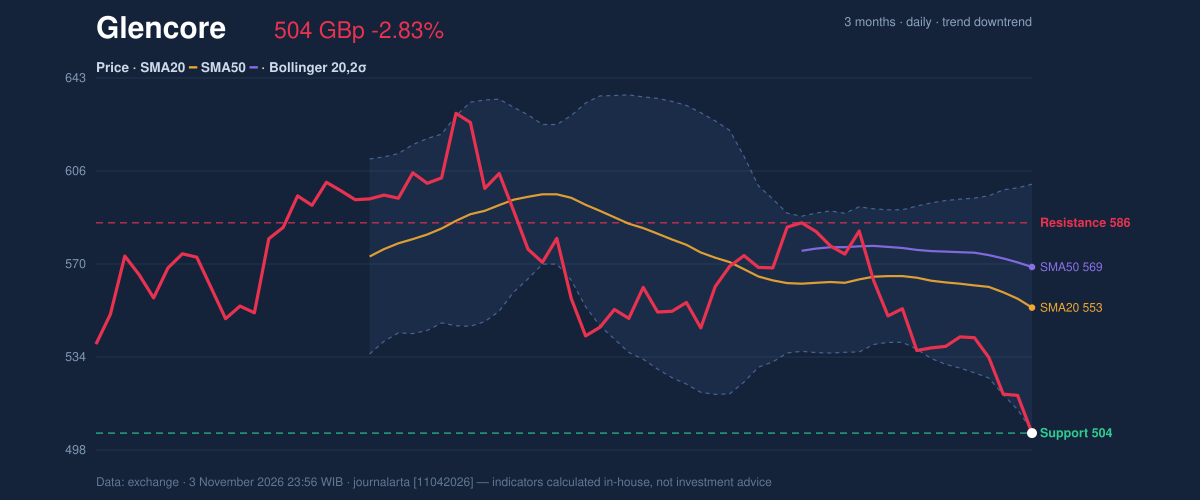
Oscillators & Momentum
The RSI, which gauges the pace of recent gains and losses, was 27.1, in oversold territory. The Stochastic readings were also deeply oversold, with %K at 0.0 and %D at 1.3. These readings mean selling has been intense relative to the recent trading pattern; they do not, on their own, show that sellers have exhausted themselves or that a reversal has begun. MACD remained negative at -13.882, below its -9.048 signal line, while its histogram was -4.834. Together, those readings show downside momentum still outweighing any evidence of a turn. The chart brings these momentum indicators together, making the contrast visible: oversold oscillators coexist with a negative MACD rather than confirming a bullish reversal.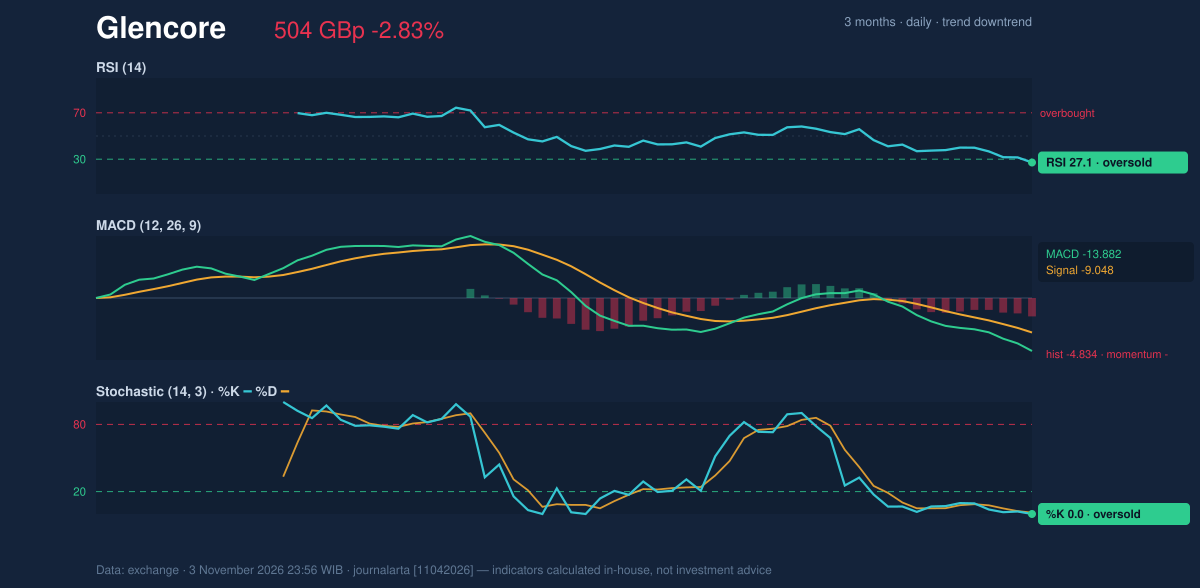
Volatility, Volume & Levels
The 20-day Bollinger Band width was 17.4%, described as normal rather than unusually compressed. Average True Range (ATR), a measure of typical price movement, was 22.60 pence, equal to 4.5% of the share price. That is high volatility: moves around the current level can be substantial, so support tests may be unsettled. Trading volume was 27,306,377 shares, about 0.9 times the 20-day average of 31,264,505. Volume was below normal, but On-Balance Volume (OBV), which tracks whether trading activity is flowing more with buying or selling, was falling. The data’s technical bias is neutral: zero of seven bullish signals and one of seven bearish signals, with that bearish signal being a downtrend confirmed by falling OBV. Neutral here means the indicators do not establish a balanced technical case for either a clear rebound or a stronger downside signal. The immediate test is support at 504.30 pence, which is also the three-month low. A sustained move below that level would place the shares beneath the reported range floor; a hold could allow the oversold readings to matter more, but would not by itself reverse the trend. On a recovery, resistance at 586.30 pence is the next stated 20-day barrier, with the 20-day average at 553.22 pence an intervening reference point. The chart shows these levels in relation to the price and moving averages.Technical Verdict: HOLD
HOLD (wait & see) matches the neutral technical bias. The strongest reasons are the conflicting oversold readings—RSI at 27.1 and Stochastic at 0.0/1.3—against a negative MACD and a falling 20-day average; the price is also testing support at the three-month low. Falling OBV adds evidence that buying pressure has not yet confirmed a recovery. The verdict is invalidated if the price falls below 504.30 pence, the stated 20-day support.- Indicative entry range: 504.30–553.22 pence, from support to the 20-day average.
- Indicative exit target: 586.30 pence, the 20-day resistance.
- Indicative stop-loss protection: 470.40 pence, the reference level at price minus 1.5 times ATR.
| Market data | Reading |
|---|---|
| Session | Tuesday, November 3, 2026 |
| Last price | 504.30 GBp |
| Daily / five-day / monthly change | -2.83% / -6.92% / -12.07% |
| SMA20 / SMA50 | 553.22 / 569.07 |
| RSI / Stochastic | 27.1 / %K 0.0, %D 1.3 |
| MACD / signal / histogram | -13.882 / -9.048 / -4.834 |
| Support / resistance | 504.30 / 586.30 GBp |
| Three-month high / low | 669.30 / 504.30 GBp |
Summary Data Glencore
| Last price | 504.30 GBp |
| Change 1 day / 5 days / 1 month | -2.83% / -6.92% / -12.07% |
| Trend / MA-cross | downtrend / none |
| SMA20 / SMA50 | 553.22 / 569.07 |
| RSI (14) / Stochastic %K | 27.1 / 0.0 |
| Bollinger %B / ATR | -1% / 22.60 |
| Support / Resistance 20 days | 504.30 / 586.30 |
| Data as of | 3 November 2026 23:56 WIB |
Disclaimer: This technical analysis is generated automatically from exchange data and indicators calculated by JournalArta, for information and education only. The verdict and the entry, target and stop-loss levels are not investment advice or a solicitation to buy or sell any security. Investment decisions and their risks rest solely with the reader.
Track Glencore share price daily: live levels, support/resistance and our full Glencore analysis history.