Rolls-Royce Stock Technicals: Drops 1.22% on Tuesday, Momentum Gains
On November 3, 2026: price 1,260.60 GBp, trend downtrend, RSI 40.2, support 1,164.20, resistance 1,404.40. technical analysis of rolls-royce stock.
Why Rolls-Royce is in focus today
- MACD histogram has just turned positive
Selected automatically from 98 LSE (UK) stocks by a technical-signal score with daily weighted randomisation — not a recommendation.
Trend & Price Action
At 1,260.60 GBp, the shares are below the 20-day average of 1,308.72 and the 50-day average of 1,409.19. The 20-day average has fallen 3.71% over five days, showing that the short-term trend itself continues to weaken. There is no new moving-average crossover to signal a change in direction. The shares sit about 40% of the way through their 20-day trading range, between support at 1,164.20 and resistance at 1,404.40. They are also close to the three-month low of 1,158.60, while remaining well below the three-month high of 1,586.00. That position leaves room for a rebound, but also places the shares near a level where renewed selling could test the recent floor. The chart shows the price below both moving averages, with Bollinger bands framing the recent range.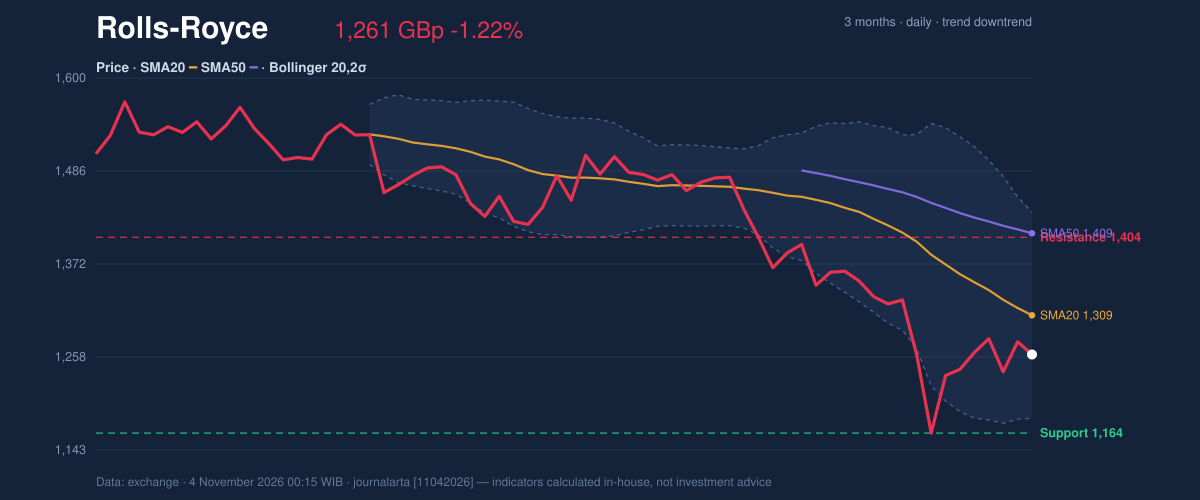
Oscillators & Momentum
The MACD histogram has just turned positive at 1.214, with MACD at -49.500 and its signal line at -50.715. The histogram measures the gap between those two lines; its move above zero indicates that downward momentum may be losing force. But both MACD readings remain negative, so this is an early improvement rather than confirmation that the trend has turned higher. The RSI is neutral at 40.2, while Stochastic %K at 25.0 and %D at 24.5 are also classified as neutral. The RSI is rebounding from below 35, one of the bullish signals in the technical assessment, but it has not reached a level that would establish strong upward momentum. Together, the indicators suggest tentative stabilization, not broad-based confirmation. The chart places RSI, MACD and Stochastic readings side by side.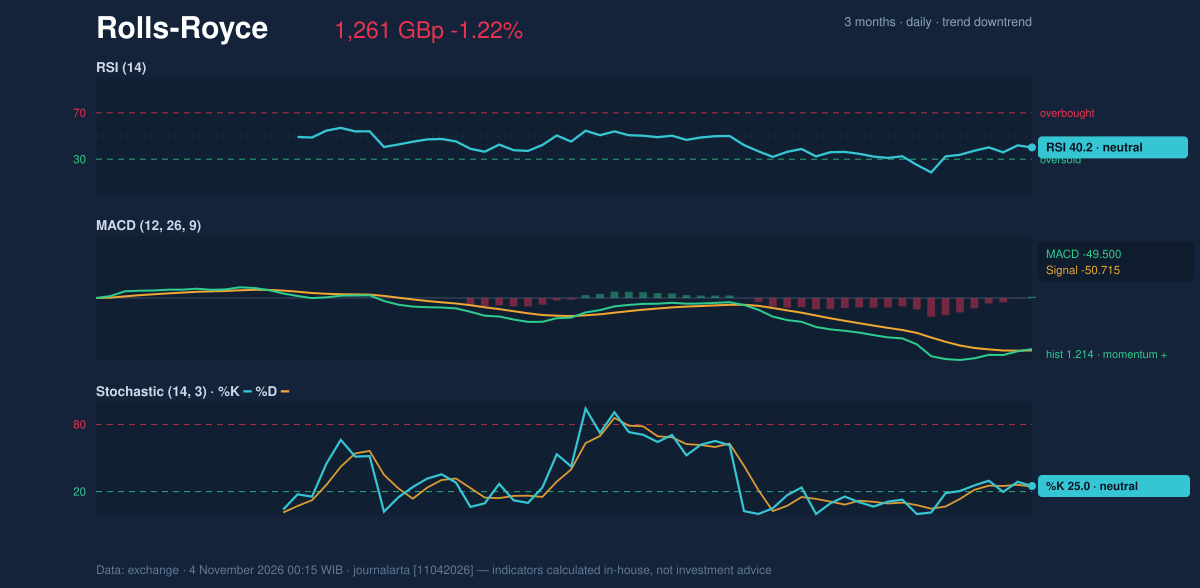
Volatility & Volume
The Bollinger %B reading is 31%, meaning the price is in the lower portion of its band range, but not at the lower boundary. The bands are at 1,182.16 below and 1,435.28 above, with a width of 19.3% classified as normal. That does not point to an unusually tight market poised for a breakout; instead, it shows the shares trading in the lower half of a still-substantial range. Volatility remains high. ATR, a measure of typical price movement, is 65.15 GBp, or 5.2% of the share price. Volume of 27,270,024 was 1.2 times its 20-day average, but OBV is falling. OBV tracks whether volume tends to accompany rising or falling prices, so its decline suggests the recent activity has not yet provided convincing evidence of sustained buying pressure.Key Levels & Scenarios
The main test on the downside is support at 1,164.20, close to the three-month low of 1,158.60. A break below the 20-day support would weaken the case that the positive MACD histogram marks a pause in selling. On the upside, resistance at 1,404.40 is the first major hurdle; the shares would also need to reclaim the 20-day average at 1,308.72 to improve the near-term price structure. The technical bias is neutral: two of seven signals are bullish and two are bearish. The MACD turn and RSI rebound are offset by the downtrend, the price’s position below the 50-day average, and falling OBV. The core signal is a possible momentum pause inside a downtrend, with neither side yet confirmed.Technical Verdict: HOLD
A neutral bias supports a wait-and-see reading. The strongest reasons are the newly positive MACD histogram, the RSI rebound from below 35, and the counterweight of falling OBV while the price remains below the moving averages. The verdict is invalidated if the price breaks below 20-day support at 1,164.20. - Entry range: 1,164.20–1,308.72, bounded by 20-day support and the 20-day average. - Exit target: 1,404.40, the 20-day resistance. - Stop-loss protection: 1,162.87, the price-minus-1.5×ATR reference level. In plain English, the indicators show a possible pause in the decline, but not enough confirmation to call a trend reversal. | Indicator | Reading | |---|---:| | Last price | 1,260.60 GBp | | Change | 1 day: -1.22% · 5 days: 1.46% · 1 month: -12.35% | | SMA20 / SMA50 | 1,308.72 / 1,409.19 | | RSI / Stochastic | 40.2 / 25.0 and 24.5 | | MACD / signal / histogram | -49.500 / -50.715 / 1.214 | | Bollinger lower / middle / upper | 1,182.16 / 1,308.72 / 1,435.28 | | ATR(14) | 65.15 GBp | | Volume / 20-day average | 27,270,024 / 23,693,386 | | OBV | Falling | | 20-day support / resistance | 1,164.20 / 1,404.40 | | Three-month low / high | 1,158.60 / 1,586.00 |Summary Data Rolls-Royce
| Last price | 1,260.60 GBp |
| Change 1 day / 5 days / 1 month | -1.22% / 1.46% / -12.35% |
| Trend / MA-cross | downtrend / none |
| SMA20 / SMA50 | 1,308.72 / 1,409.19 |
| RSI (14) / Stochastic %K | 40.2 / 25.0 |
| Bollinger %B / ATR | 31% / 65.15 |
| Support / Resistance 20 days | 1,164.20 / 1,404.40 |
| Data as of | 4 November 2026 00:15 WIB |
Disclaimer: This technical analysis is generated automatically from exchange data and indicators calculated by JournalArta, for information and education only. The verdict and the entry, target and stop-loss levels are not investment advice or a solicitation to buy or sell any security. Investment decisions and their risks rest solely with the reader.
Track Rolls-Royce share price daily: live levels, support/resistance and our full Rolls-Royce analysis history.