On November 3, 2026: price 1,258.00 GBp, trend downtrend, RSI 24.8, support 1,258.00, resistance 1,430.80. technical analysis of hsbc stock.
By Elena Vance
November 4, 20264 min read
Logo HSBC Holdings — JournalArta illustration
Why HSBC is in focus today
Closed at a 20-day low (1,258.00)
Trading near its 3-month low (1,256.40)
RSI(14) at 24.8 — oversold zone
Downtrend extending (5-day change -2.59%)
Selected automatically from 98 LSE (UK) stocks by a technical-signal score with daily weighted randomisation — not a recommendation.
HSBC Holdings closed at 1,258.00 GBp on Tuesday, November 3, at its lowest level in the past 20 trading days and close to its three-month low of 1,256.40 GBp. The shares fell 1.98% in the session and 2.59% over five days, extending a downtrend. Yet the technical picture is not uniformly bearish: oversold readings sit alongside falling volume flow, while the price is testing a floor that has barely held.
That tension matters.
Trend & Price Action
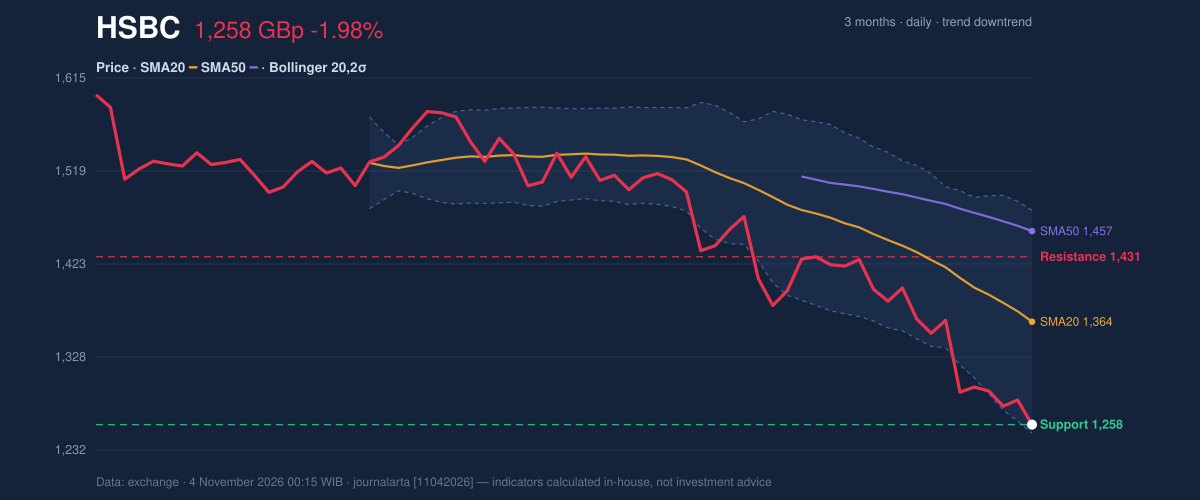
The share price is below both its 20-day simple moving average, at 1,363.97 GBp, and its 50-day average, at 1,457.21 GBp. The 20-day average fell 3.20% over five days, showing that the short-term trend is weakening rather than merely reflecting a single bad session. No new moving-average cross formed in the latest data.
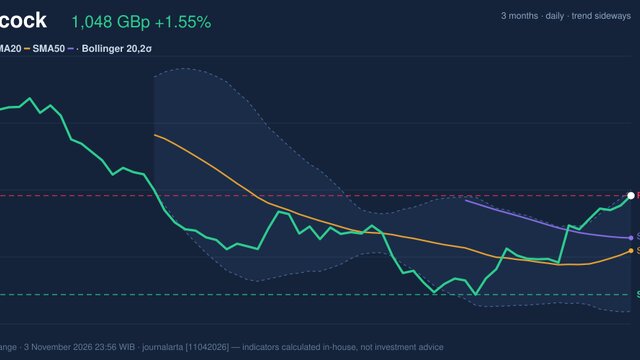
At 1,258.00 GBp, the close matched the stated 20-day support and sat just above the three-month low. The chart therefore shows a market pressing against established support, not one that has already broken decisively below it. As shown in the chart, the price is near the lower Bollinger band, while both moving averages remain overhead.
3-month price action chart of HSBC: price, SMA20/50, Bollinger, support & resistance.
Advertisement
The Bollinger position reinforces the pressure: the close was at 4% of the band’s range, near the lower boundary of 1,249.30 GBp. The band width of 16.8% is classified as normal, so the data do not point to an unusually compressed setup preceding a sharp breakout. The lower band is a volatility measure, not a guaranteed floor.
Oscillators & Momentum
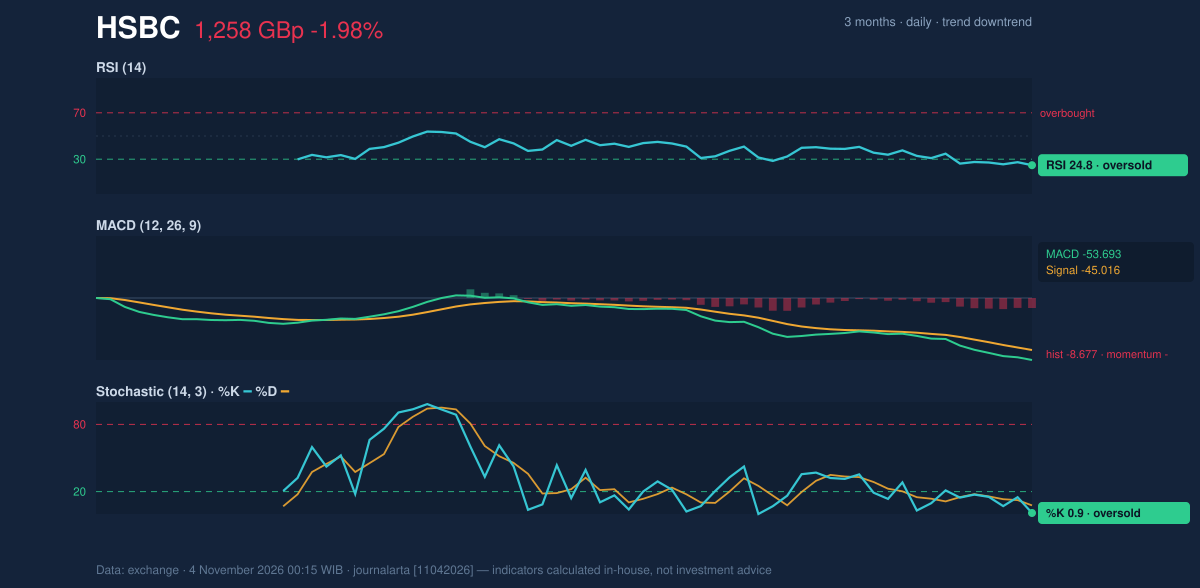
Momentum indicators show substantial selling, but do not yet confirm a turn. RSI(14) is 24.8, in oversold territory, while Stochastic %K at 0.9 and %D at 7.7 are also oversold. These readings describe the intensity of recent declines; they do not, by themselves, establish that the fall is over.
The MACD remains negative at -53.693, below its -45.016 signal line, with a negative histogram of -8.677. That alignment points to continuing downward momentum. In other words, the oscillators warn that selling has gone far, while MACD says sellers still have the stronger signal.
Momentum chart of HSBC: RSI(14), MACD, Stochastic.
Volatility, Volume & Key Levels
Trading volume reached 31,082,692 shares, about 1.3 times the 20-day average of 24,133,088. Higher-than-usual activity on a falling session suggests the decline attracted meaningful participation rather than occurring on thin trading. The falling OBV—an indicator that tracks whether volume is flowing more into rising or falling sessions—adds evidence that buying has not yet absorbed the selling pressure.
ATR(14), a measure of typical price movement, stands at 31.74 GBp, or 2.5% of the share price. That points to moderate volatility, but a move of this scale can still make a close near support vulnerable to further swings.
Support is 1,258.00 GBp, with the three-month low at 1,256.40 GBp; resistance is 1,430.80 GBp. A sustained break below the nearby support zone would put the price below both reference lows. If support holds, an initial recovery would still face the 20-day average at 1,363.97 GBp before reaching resistance. The 3-month high is 1,610.00 GBp.
Advertisement
Technical Verdict: HOLD
The required technical bias is neutral, so the verdict is HOLD (wait & see), rather than a directional call. The strongest signals are mixed: oversold RSI and Stochastic readings raise the possibility of a pause, but negative MACD and falling OBV show that downside momentum and selling pressure remain. The close exactly at 20-day support makes confirmation important.
- Indicative entry range: 1,256.40–1,258.00 GBp, the three-month low to 20-day support.
- Exit target: 1,363.97 GBp, the 20-day average; the next stated resistance is 1,430.80 GBp.
- Stop-loss reference: 1,210.38 GBp, the price minus 1.5 times ATR; a close below 1,256.40 GBp would also break the stated three-month low.
- Invalidation: The neutral verdict is invalidated if the price breaks below 1,256.40 GBp, weakening the case that the support zone is holding.
For non-traders, the signals are divided: the shares are heavily oversold, but there is not yet clear evidence that the downward pressure has ended.
| Indicator | Latest reading |
|---|---:|
| Close | 1,258.00 GBp |
| Change | -1.98% (1 day); -2.59% (5 days); -14.55% (1 month) |
| SMA20 / SMA50 | 1,363.97 / 1,457.21 GBp |
| RSI(14) | 24.8 |
| MACD / signal / histogram | -53.693 / -45.016 / -8.677 |
| Volume / 20-day average | 31,082,692 / 24,133,088 |
| 20-day support / resistance | 1,258.00 / 1,430.80 GBp |
| Three-month low / high | 1,256.40 / 1,610.00 GBp |
Advertisement
Summary Data HSBC
Last price
1,258.00 GBp
Change 1 day / 5 days / 1 month
-1.98% / -2.59% / -14.55%
Trend / MA-cross
downtrend / none
SMA20 / SMA50
1,363.97 / 1,457.21
RSI (14) / Stochastic %K
24.8 / 0.9
Bollinger %B / ATR
4% / 31.74
Support / Resistance 20 days
1,258.00 / 1,430.80
Data as of
4 November 2026 00:15 WIB
Disclaimer: This technical analysis is generated automatically from exchange data and indicators calculated by JournalArta, for information and education only. The verdict and the entry, target and stop-loss levels are not investment advice or a solicitation to buy or sell any security. Investment decisions and their risks rest solely with the reader.