Babcock Stock Technicals: Gains 1.55% on Tuesday, Testing Key Resistance
On November 3, 2026: price 1,047.50 GBp, trend sideways, RSI 67.7, support 887.20, resistance 1,047.50. technical analysis of babcock stock.
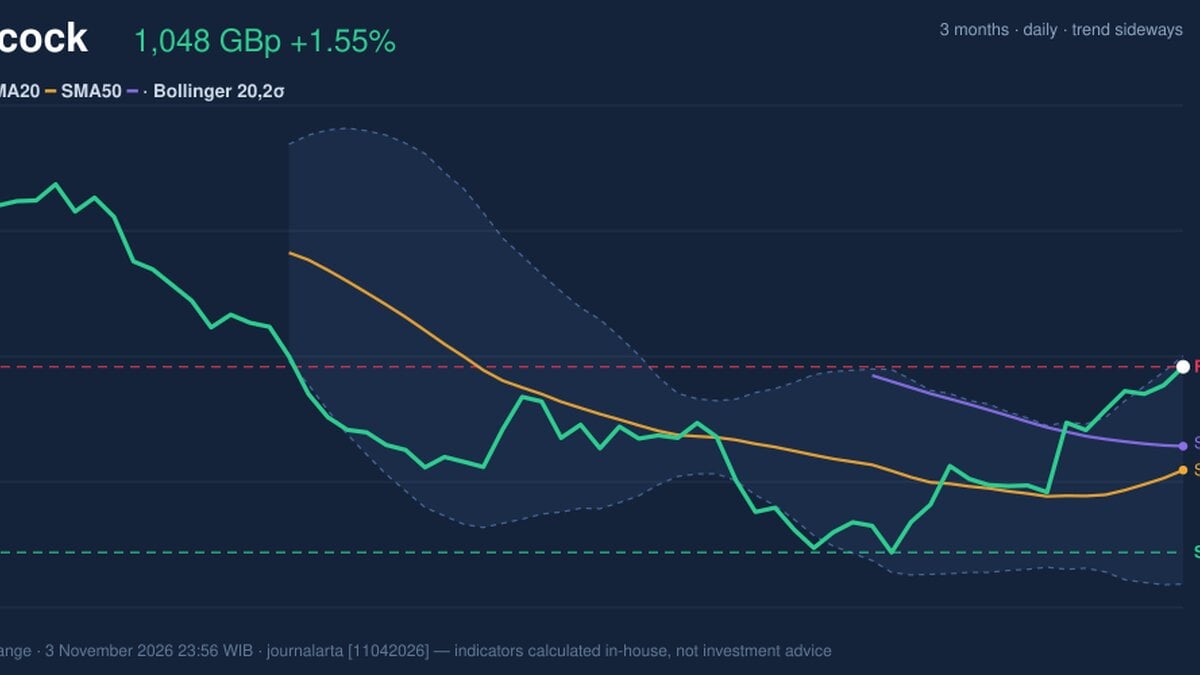
Why Babcock is in focus today
- Closed at a 20-day high (1,047.50)
- Not covered by JournalArta in the last 14 days
Selected automatically from 98 LSE (UK) stocks by a technical-signal score with daily weighted randomisation — not a recommendation.
Trend & Price Action
The shares are above both the 20-day simple moving average, at 958.30 GBp, and the 50-day average, at 978.89 GBp. The 20-day average rose 2.40% over five days, a sign that the near-term trend is improving. But the averages have not formed a new crossover, so there is no fresh technical signal confirming a change in the broader pattern. The data describes the trend as sideways, even as the price has climbed. That distinction matters: a rising share price can approach a ceiling within an established range without yet establishing a sustained trend. Babcock closed at its 20-day resistance of 1,047.50 GBp and at 100% of its 20-day range. The next larger reference point is the three-month high of 1,226.00 GBp. The price is testing its ceiling, not clearing it. As shown in the chart, the shares sit close to the upper Bollinger Band, while the moving averages and marked support and resistance levels show how far the recent advance has moved from its trading base.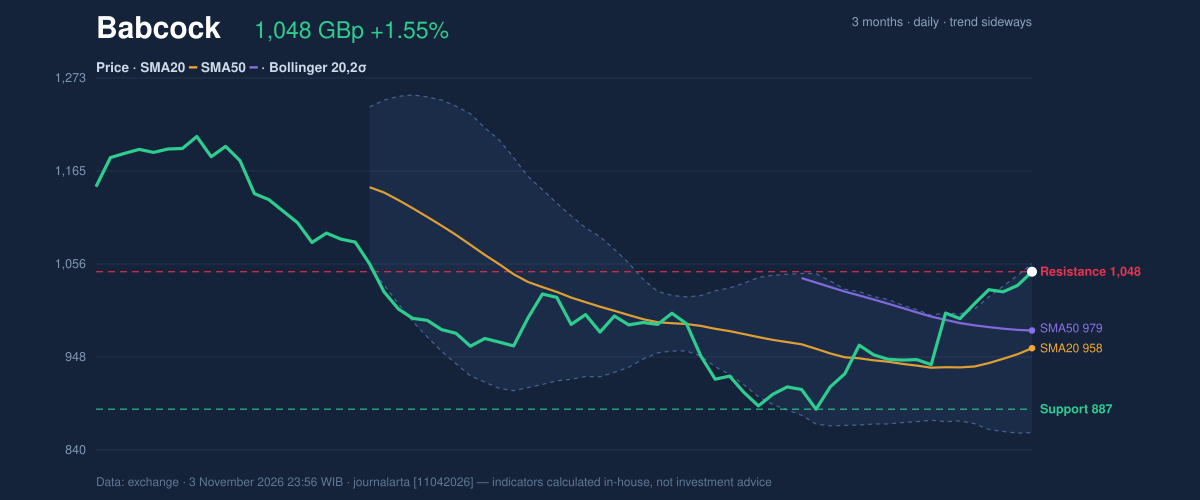
Oscillators & Momentum
Momentum indicators support the advance, but they also flag the risk of near-term fatigue. The RSI is 67.7, classified as neutral in the supplied data. The Stochastic reading is more extended: %K at 98.3 and %D at 92.0, both in overbought territory. Overbought does not automatically mean a reversal; it means prices have risen quickly enough that a pause or pullback becomes a material possibility. MACD points the other way. Its reading of 16.082 is above the signal line at 1.412, leaving a positive histogram of 14.670. This indicates strengthening upward momentum, though it cannot by itself confirm that resistance has been overcome. The combination is mixed: MACD backs the rally, while the Stochastic warns that the move is crowded in the short term. The chart helps separate those signals: MACD reflects direction and momentum, while the Stochastic gauges how stretched the latest move has become.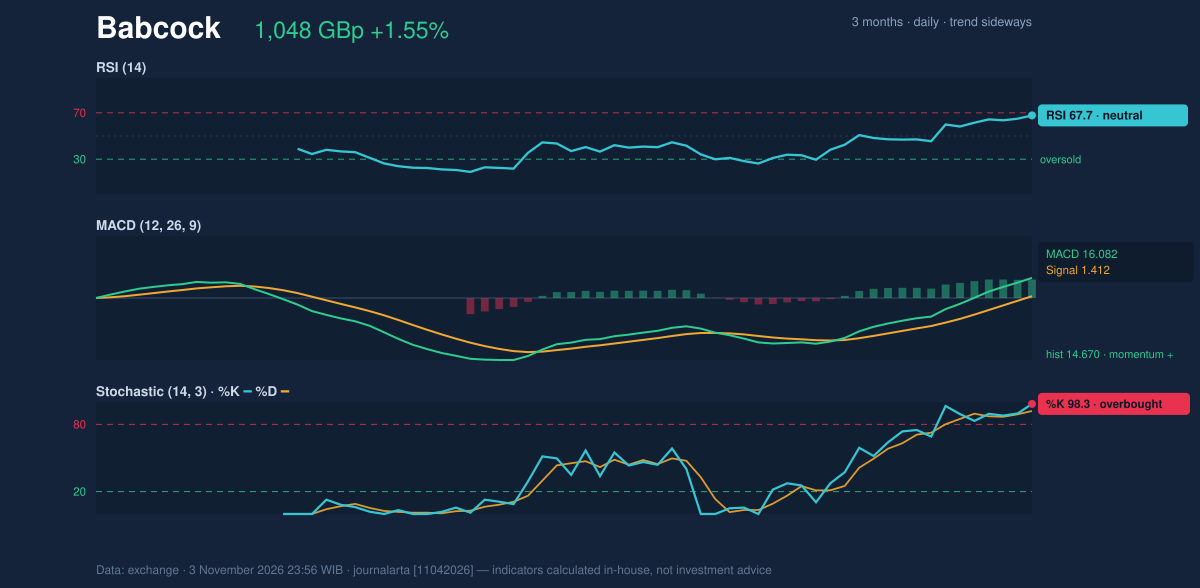
Volatility, Volume & Levels
The Bollinger reading reinforces the tension. The price is at 95% of the band range, close to the upper band at 1,056.80 GBp, and the bands are widening, with a width of 20.6%. Widening bands indicate higher volatility and larger price swings; they do not determine whether the next move will be up or down. The average true range is 33.60 GBp, or 3.2% of the share price, consistent with moderate volatility. Trading participation adds some confirmation: volume was 1,860,782 shares, or 1.2 times the 20-day average, and OBV was rising. OBV, or on-balance volume, tracks whether trading volume is flowing more heavily on rising or falling sessions. Its increase suggests the advance has attracted participation, rather than being driven by a thin session. The main test is whether the shares can hold above the 20-day resistance. A sustained break would put the three-month high at 1,226.00 GBp in view as the next reference level. If the price fails to hold the breakout area, the ATR-based level of 997.10 GBp offers a nearer downside reference, with 20-day support at 887.20 GBp. The three-month low is 871.20 GBp.Technical Verdict: HOLD
The neutral bias calls for a wait-and-see reading rather than a directional signal. First, the price is testing resistance without a new moving-average crossover. Second, the Stochastic is overbought at 98.3 / 92.0, raising the risk of a pause. Third, positive MACD, rising OBV and above-average volume argue against treating the advance as technically weak. The verdict is invalidated if the price falls below 887.20 GBp, the 20-day support.- Ideal Entry Range: 997.10–1,047.50 GBp, between the ATR-based reference and 20-day resistance.
- Exit Target (Target Price): 1,226.00 GBp, the three-month high, if resistance is cleared.
- Stop Loss protection: below 887.20 GBp, the 20-day support.
| Indicator | Reading |
|---|---|
| Last price | 1,047.50 GBp |
| Technical bias | Neutral |
| RSI (14) | 67.7 |
| Stochastic %K / %D | 98.3 / 92.0 |
| MACD / signal | 16.082 / 1.412 |
| 20-day support / resistance | 887.20 / 1,047.50 GBp |
Summary Data Babcock
| Last price | 1,047.50 GBp |
| Change 1 day / 5 days / 1 month | 1.55% / 5.51% / 15.54% |
| Trend / MA-cross | sideways / none |
| SMA20 / SMA50 | 958.30 / 978.89 |
| RSI (14) / Stochastic %K | 67.7 / 98.3 |
| Bollinger %B / ATR | 95% / 33.60 |
| Support / Resistance 20 days | 887.20 / 1,047.50 |
| Data as of | 3 November 2026 23:56 WIB |
Disclaimer: This technical analysis is generated automatically from exchange data and indicators calculated by JournalArta, for information and education only. The verdict and the entry, target and stop-loss levels are not investment advice or a solicitation to buy or sell any security. Investment decisions and their risks rest solely with the reader.
Track Babcock share price daily: live levels, support/resistance and our full Babcock analysis history.