Qantas Airways Share Price Latest: Little Changed on Friday, Up 16.4% in a Month
Technical analysis of Qantas stock on November 13, 2026: price 9.70 AUD, trend uptrend, RSI 62.3, support 8.23, resistance 9.96.

Why Qantas is in focus today
- Fresh golden cross: SMA20 crossed above SMA50
- Uptrend confirmed (5-day change 4.19%)
Selected automatically from 58 ASX (Australia) stocks by a technical-signal score with daily weighted randomisation — not a recommendation.
Trend & Price Action
The 20-day simple moving average (SMA20) sits at 9.06 and the 50-day (SMA50) at 8.91, so the price is above the SMA20. The golden cross means the faster average has climbed through the slower one. In plain terms, recent prices have been higher than the longer-run norm for long enough to tilt the averages. The 20-day average rose 4.51% over five days, which shows the shift is still building rather than fading. The chart below shows how the price has stayed above both averages while the gap between them widened.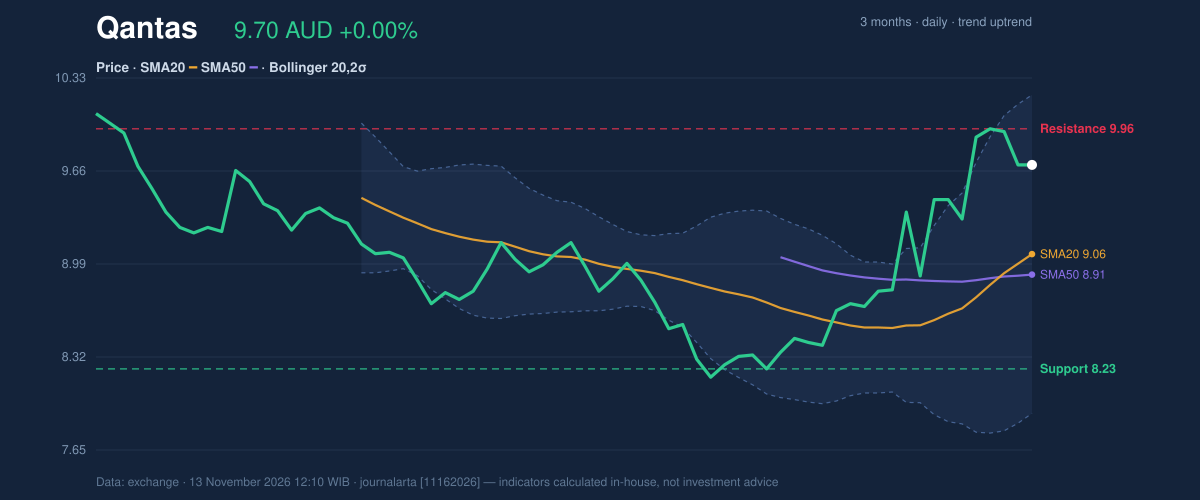
Oscillators & Momentum
Momentum indicators mostly agree with the trend, with one note of caution. The Relative Strength Index (RSI), which measures how strong recent gains are against recent losses, reads 62.3. That is neutral: firm, but short of the overbought area that often precedes a pause. The MACD line, a gauge of the gap between short and long-term averages, stands at 0.291 against a signal line of 0.189. The histogram of 0.102 is positive, meaning upward momentum is still outpacing its own smoothed average. The caution comes from the Stochastic oscillator. Its %K of 75.4 sits below its %D of 82.5. Both are in neutral territory, but %K under %D shows short-term buying pressure cooling after the recent run. The system's signal scan also flags one bearish reading: RSI rolling over from above 65. Neither signal reverses the trend. They suggest the pace of the advance may be easing.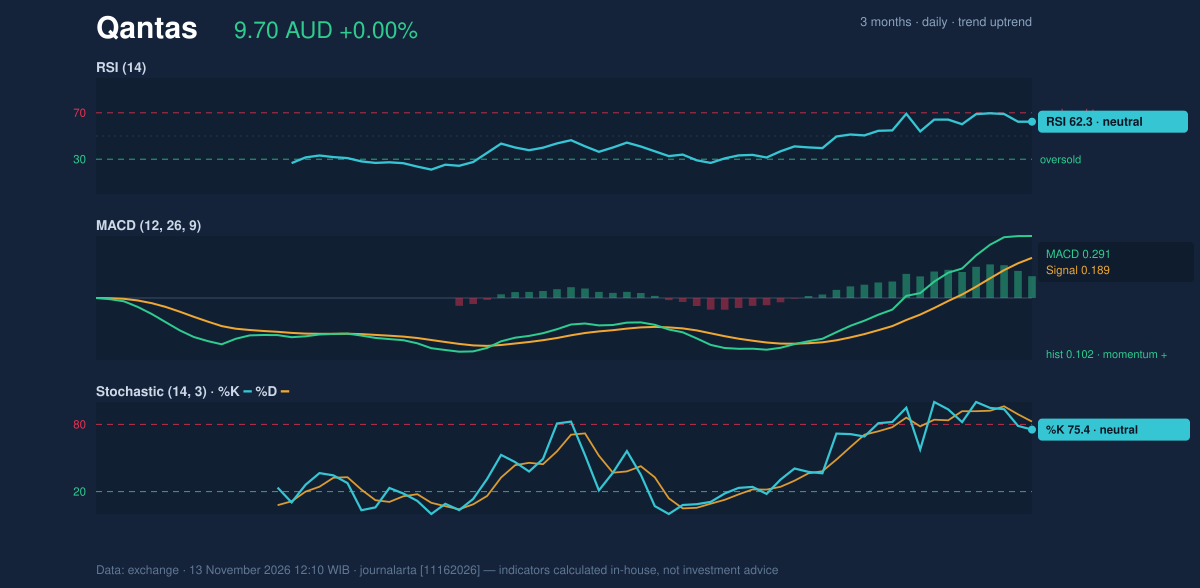
Volatility & Volume
Bollinger Bands, which trace a price envelope two standard deviations around the 20-day average, run from 7.91 to 10.20 with the middle at 9.06. The bands are widening, with a width of 25.3%, which signals elevated volatility. The price sits at 78% of the band (%B), in the upper portion but not pressing the 10.20 ceiling. The Average True Range (ATR) is 0.33, or 3.4% of the price, a moderate level of daily swing. Volume tells a more tempered story. Friday's turnover was 2,966,058 shares against a 20-day average of 7,139,952, about 0.4 times the norm. Thin trading on a flat day does not by itself undermine a rally, since quiet sessions often follow sharp gains. On-balance volume (OBV), which tallies volume on up days against down days, is rising, so buying has outweighed selling over the period. The test will come when volume returns.Key Levels & Scenarios
Resistance at 9.96 is the first obstacle, with the three-month high of 10.18 and the upper Bollinger Band at 10.20 clustered just above it. A close through 9.96 on stronger volume would put those higher markers in play and give the golden cross real confirmation. If the stock fails to hold the 9.06 SMA20, the cross loses much of its meaning, and support at 8.23 becomes the next reference point.Technical Verdict: BUY
JournalArta's research model scores Qantas at +68 on a scale of −100 to +100, above the +60 threshold for a BUY reading. The strongest reasons:- Trend structure: the price is above the SMA50, and the SMA20 is above the SMA50 after the golden cross.
- Momentum: RSI at 62.3 sits in the healthy 50–70 zone, and the MACD histogram is positive at 0.102.
- Participation: OBV is rising, even though Friday's volume was light.
- Entry range: 9.46 – 9.70
- Exit target 1: 10.54 (reward/risk 1.5)
- Exit target 2: 11.38 (reward/risk 3.0)
- Stop loss: 9.14
Summary Data Qantas
| Last price | 9.70 AUD |
| Change 1 day / 5 days / 1 month | 0.00% / 4.19% / 16.45% |
| Trend / MA-cross | uptrend / golden |
| SMA20 / SMA50 | 9.06 / 8.91 |
| RSI (14) / Stochastic %K | 62.3 / 75.4 |
| Bollinger %B / ATR | 78% / 0.33 |
| Support / Resistance 20 days | 8.23 / 9.96 |
| Data as of | 13 November 2026 12:10 WIB |
| JournalArta research verdict (score) | Buy (+68) |
| Entry zone | 9.46 – 9.70 |
| Target 1 / 2 | 10.54 / 11.38 |
| Stop loss | 9.14 |
| Reward/risk | 1.5 / 3.0 |
Today's full Buy and Sell list for US stocks →
Disclaimer: This technical analysis is generated automatically from exchange data and indicators calculated by JournalArta, for information and education only. The verdict and the entry, target and stop-loss levels are not investment advice or a solicitation to buy or sell any security. Investment decisions and their risks rest solely with the reader.
Track Qantas share price daily: live levels, support/resistance and our full Qantas analysis history.
 Take the quizWhat Kind of Holiday Spender Are You? Take the Black Friday QuizStart →
- 1Mavericks Surfers Race to California for Waves Near 50 Feet

- 2NYC Medical Examiner Has Not Determined Cause of Death of Beau Rose Jessup

- 3Rugby League World Cup Final 2026: Kick-Off Times and How to Watch Kangaroos v New Zealand

- 4Mountaineer Finds Ice Age Cave Bear Graveyard in the Dolomites

- 5I’m A Celebrity 2026 Line-Up: Rooney Leads 11 Stars Into Jungle

 Lifestyle7 Signs Your Social Battery Is Running Low (and Why You Keep Cancelling Plans)
 Lifestyle · Food & HealthThanksgiving Food Safety: How Long Leftovers Last and the Safe Turkey Temperature
 Lifestyle7 Quiet Habits of Emotionally Intelligent People, According to Psychologists
 LifestylePeople Who Don’t Like Celebrating Their Birthday Often Share These 7 Traits