Citigroup Stock on Wednesday: Slides 2.17%, Near a 3-Month Low
Technical analysis of Citigroup stock on November 18, 2026: price 117.34 USD, trend downtrend, RSI 36.5, support 117.34, resistance 125.76.

Why Citigroup is in focus today
- One-day move of 0.00%, about 0.0× its average daily range (ATR)
Selected automatically from 11 NYSE (US) stocks by a technical-signal score with daily weighted randomisation — not a recommendation.
Trend & Price Action: Below Every Reference Line
The structure is unambiguously bearish. Citigroup trades beneath its 20-day average of 122.13 and well under its 50-day average of 126.78, with the 20-day average itself falling — its slope was -0.36% over five days. That combination (price below both averages, shorter average below the longer one) is the textbook anatomy of a downtrend rather than a pullback. Notably, the DATA shows no fresh moving-average cross on this date; the bearish alignment was established earlier and has simply persisted. The stock's three-month high of 141.27 now sits far overhead, while its three-month low of 117.09 is practically at the closing price — a market that has spent weeks eroding value rather than consolidating it. The most telling technical event is the Bollinger Band picture. The bands are 7.0% wide and narrowing — a squeeze that typically precedes a sharp directional move. That squeeze has resolved to the downside: the close at 117.34 is below the lower band of 117.83, putting the %B reading at -6%. A negative %B means price has broken outside the band's floor, which in a squeezed, downtrending setup reads as a volatility expansion lower rather than a mean-reversion opportunity.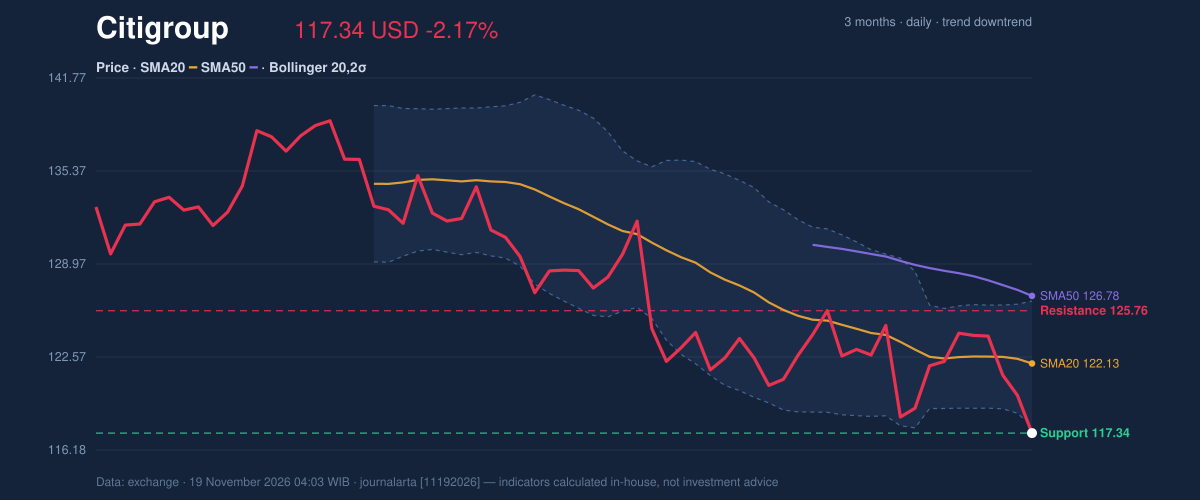
Oscillators & Momentum: Oversold, But Not a Buy Signal
The momentum readings are internally consistent, which is what makes them credible. RSI(14) at 36.5 is in neutral territory but tilted toward weakness. Stochastic is where the stress shows: %K at 2.4 against %D at 23.2 is a deeply oversold reading and a steep negative crossover — in plain terms, the stock has been sold hard enough to register as technically exhausted on a short-term basis. For general readers: oversold does not mean "due to bounce"; in a confirmed downtrend it often means "still falling, but with less room before a technical pause." MACD reinforces rather than contradicts. The line at -1.594 sits below its signal at -1.520, with a histogram of -0.073 — negative momentum, though the small histogram suggests the decline is not accelerating violently. Zero bullish signals against four bearish ones across the code-computed signal set tells the story: no oscillator is flashing a reversal, only exhaustion.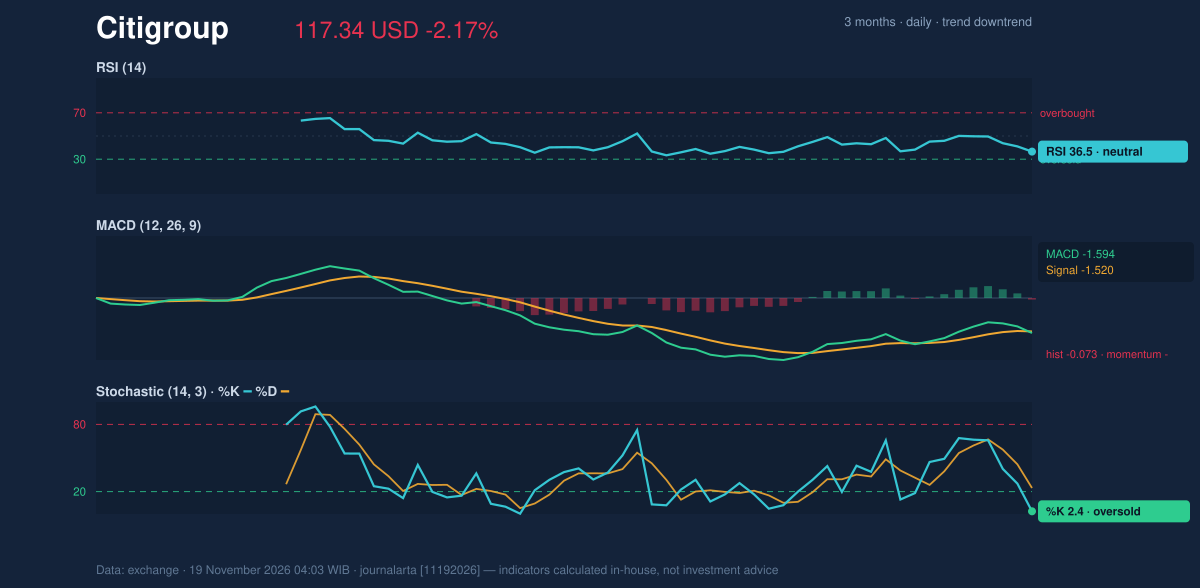
Volatility & Volume: Participation Confirms the Direction
ATR(14) of 3.70 represents about 3.2% of the price — moderate volatility, meaning daily swings of this magnitude are normal and a single session does not constitute capitulation. The on-balance volume (OBV) line is falling, and that is the quiet confirmation that matters: volume is accumulating on down days, not up days, so the selling reflects genuine distribution rather than thin, noisy trading. Elevated volume at 1.2× normal, on a close at the range floor, is participation in the decline — not a buyer's strike.Key Levels & Scenarios
Support is immediate and thin: 117.34 is the 20-day support and the closing price itself, with the three-month low of 117.09 just beneath. Resistance sits at 125.76. If the stock fails to hold 117.09, the path opens toward the 103.59 area implied by the research targets below; a reclaim of 122.13 (the 20-day average) would be the first genuine sign the downtrend is stalling, while 125.76 would be required to neutralize it. Conversely, the squeezed Bollinger setup means a sharp move in either direction is more likely than continued drift.Technical Verdict: SELL
The JournalArta research call is SELL, scored -92 on a −100 to +100 scale (sell threshold: −60 or below), with zero bullish against four bearish signals: a MACD histogram that has just turned negative, a bounce into the 20-day average that failed within a downtrend, a Bollinger squeeze resolved with a close below the lower band, and a downtrend confirmed by falling OBV. Price below the 50-day average, with the 20-day average below it, completes the picture. The verdict is invalidated if price breaks above the stop at 126.51.- Entry (sell zone): 117.34 – 120.12
- Exit / Target 1: 103.59
- Exit / Target 2: 89.83
- Stop Loss: 126.51
- Reward/Risk: 1.5 / 3.0 — valid until 17 December 2026
Summary Data Citigroup
| Last price | 117.34 USD |
| Change 1 day / 5 days / 1 month | -2.17% / -5.53% / -5.26% |
| Trend / MA-cross | downtrend / none |
| SMA20 / SMA50 | 122.13 / 126.78 |
| RSI (14) / Stochastic %K | 36.5 / 2.4 |
| Bollinger %B / ATR | -6% / 3.70 |
| Support / Resistance 20 days | 117.34 / 125.76 |
| Data as of | 19 November 2026 04:03 WIB |
| JournalArta research verdict (score) | Sell (-92) |
| Sell zone | 117.34 – 120.12 |
| Target 1 / 2 | 103.59 / 89.83 |
| Stop loss | 126.51 |
| Reward/risk | 1.5 / 3.0 |
Today's full Buy and Sell list for US stocks →
Disclaimer: This technical analysis is generated automatically from exchange data and indicators calculated by JournalArta, for information and education only. The verdict and the entry, target and stop-loss levels are not investment advice or a solicitation to buy or sell any security. Investment decisions and their risks rest solely with the reader.
Track Citigroup stock price daily: live levels, support/resistance and our full Citigroup analysis history.
 Take the quizWhat Kind of Holiday Spender Are You? Take the Black Friday QuizStart →
- 1Gold Silver Price November: Futures Rise Near Yearly Lows

- 2U.S. Emergency Alert Test Nov. 17 Is Not a Power Outage

- 3Michael Clarke Says Sandpapergate Scars Drew Steve Smith to New York

- 42027 NFL Mock Draft Puts Ohio State’s Jeremiah Smith at No. 1

- 5Brent Crude Slides 4.05% as Rising US Stockpiles Weigh on Oil
 Lifestyle · Food & HealthWhat Is Raynaud’s Syndrome? Why Fingers Turn White in the Cold
 Lifestyle · Food & Health4 Ways Walking After Meals Helps Your Body, Doctors Say
 Lifestyle · Food & Health4 Reasons to Eat Oatmeal, According to Nutrition Experts
 Lifestyle7 Signs Your Social Battery Is Running Low (and Why You Keep Cancelling Plans)