Union Pacific (UNP) Stock Rises 1.30% on Wednesday, Up 4.5% in a Month
Technical analysis of UNP stock on November 18, 2026: price 300.90 USD, trend uptrend, RSI 54.3, support 290.16, resistance 308.53.

Why UNP is in focus today
Selected automatically from 11 NYSE (US) stocks by a technical-signal score with daily weighted randomisation — not a recommendation.
Trend & Price Action
The structural picture is constructive. UNP trades above both its 20-day average of $300.33 and its 50-day average of $288.05, with the 20-day average itself above the 50-day — the classic geometry of an established uptrend. No fresh moving-average cross has formed, which is a good thing: the trend is mature rather than freshly minted, and there is no crossover signal to fade. As shown in the chart, price sits at 58% of its 20-day range, between support at $290.16 and resistance at $308.53, having already absorbed the pullback into the 20-day average that the prior week's −0.40% reading implied. That pullback, held within an uptrend, is precisely the pattern the selection signals flag as bullish.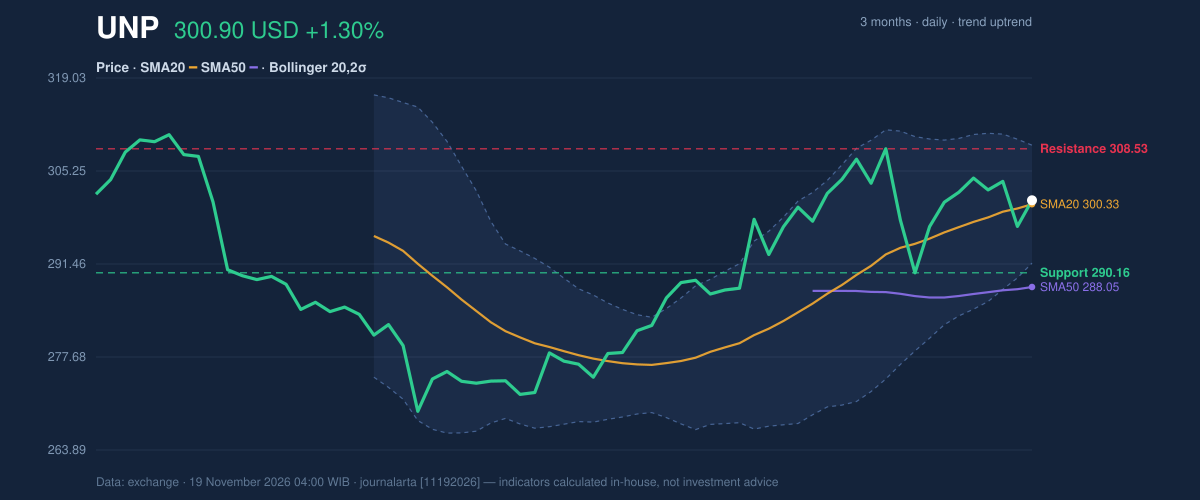
Oscillators & Momentum
Momentum is the one place where the bullish case has a visible crack. RSI(14) at 54.3 is squarely neutral, neither overbought nor oversold, and Stochastic readings of 56.2 (fast) against 54.5 (slow) are similarly non-committal. The MACD line at 3.250 sits below its signal at 3.851, leaving a negative histogram of −0.602 — a reminder that the recovery is a grind, not a breakout.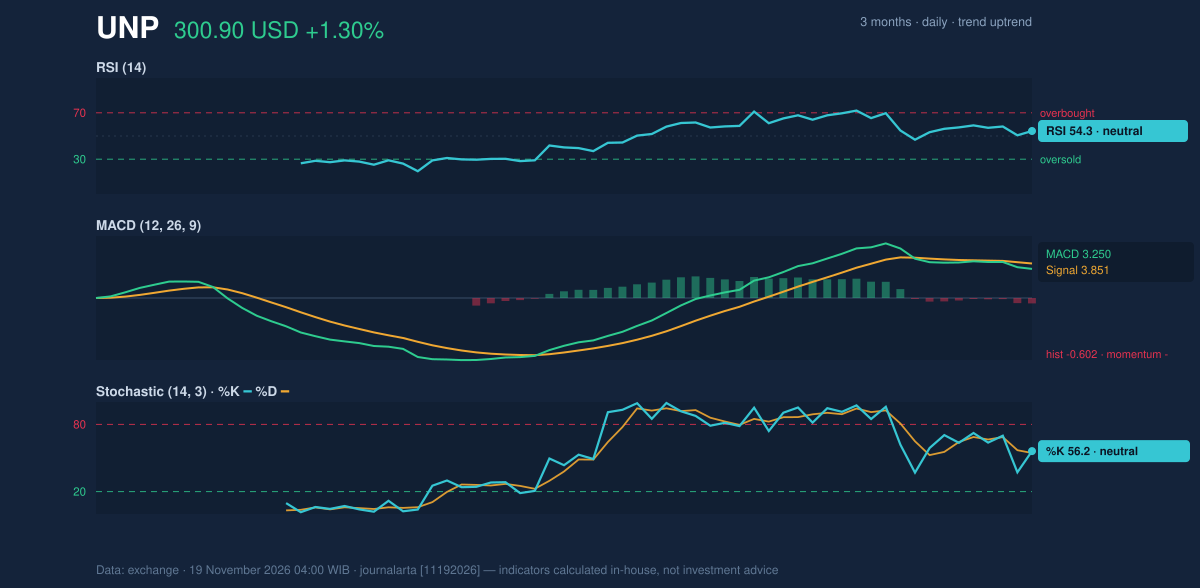
Volatility & Volume
ATR(14) of $6.72, or 2.2% of the share price, describes moderate volatility — enough for a daily range to matter, not so much that the trend is unstable. Against a 5.8% band squeeze, that daily swing allowance suggests any resolution could travel several dollars quickly once the range breaks. Volume tells the more reliable story. Since OBV is rising, accumulation is building even as price chops sideways; that divergence between a flat tape and rising on-balance volume is the footprint of steady institutional buying.Fundamental Context
The technical recovery has a fundamental companion. According to its SEC filing, Union Pacific reported quarterly revenue of $7.20 billion for the quarter ended September 30, 2026, up 15.3% from $6.24 billion a year earlier, with net income of $2.08 billion and diluted earnings per share of $3.49. That is a company whose earnings engine is accelerating while its share price digests gains — a combination that supports the trend rather than contradicting it.Key Levels & Scenarios
On the upside, a close above resistance at $308.53 would mark the squeeze resolution and open the path toward the three-month high of $314.15; failure to clear it keeps the stock range-bound. On the downside, the 20-day support at $290.16 is the line that separates a healthy pullback from a trend break, with the lower Bollinger band at $291.60 reinforcing it. A break below that cluster would invalidate the current constructive read.Technical Verdict: BUY
The signals support a constructive stance. Three reasons stand out: price holds above its 50-day average of $288.05 with the 20-day average above the 50-day, evidence of an intact uptrend; rising OBV confirms that the sideways phase is accumulation, not distribution; and the 20-day average's measured 1.15% rise over five days shows the trend is still advancing. The main risk is the negative MACD histogram at −0.602, which argues for patience on entry rather than chasing. - Entry range: $295.87 – $300.90 - Exit targets: $319.03 (target 1), $337.17 (target 2) - Stop loss: $288.81 - Reward/risk: 1.5 / 3.0; setup valid until December 17, 2026 The verdict is invalidated if price breaks and holds below $288.81, the stop level, which would also mark a loss of the 50-day trend. In plain terms: the trend and the buyers are both pointing up, but the momentum gauge says wait for a dip into the entry zone rather than pay up for the first tick.Summary Data UNP
| Last price | 300.90 USD |
| Change 1 day / 5 days / 1 month | 1.30% / -0.40% / 4.53% |
| Trend / MA-cross | uptrend / none |
| SMA20 / SMA50 | 300.33 / 288.05 |
| RSI (14) / Stochastic %K | 54.3 / 56.2 |
| Bollinger %B / ATR | 53% / 6.72 |
| Support / Resistance 20 days | 290.16 / 308.53 |
| Data as of | 19 November 2026 04:00 WIB |
| JournalArta research verdict (score) | Buy (+74) |
| Entry zone | 295.87 – 300.90 |
| Target 1 / 2 | 319.03 / 337.17 |
| Stop loss | 288.81 |
| Reward/risk | 1.5 / 3.0 |
Today's full Buy and Sell list for US stocks →
Disclaimer: This technical analysis is generated automatically from exchange data and indicators calculated by JournalArta, for information and education only. The verdict and the entry, target and stop-loss levels are not investment advice or a solicitation to buy or sell any security. Investment decisions and their risks rest solely with the reader.
Track UNP stock price daily: live levels, support/resistance and our full UNP analysis history.
 Take the quizWhat Kind of Holiday Spender Are You? Take the Black Friday QuizStart →
- 1Gold Silver Price November: Futures Rise Near Yearly Lows

- 2U.S. Emergency Alert Test Nov. 17 Is Not a Power Outage

- 3Michael Clarke Says Sandpapergate Scars Drew Steve Smith to New York

- 42027 NFL Mock Draft Puts Ohio State’s Jeremiah Smith at No. 1

- 5Brent Crude Slides 4.05% as Rising US Stockpiles Weigh on Oil
 Lifestyle · Food & HealthWhat Is Raynaud’s Syndrome? Why Fingers Turn White in the Cold
 Lifestyle · Food & Health4 Ways Walking After Meals Helps Your Body, Doctors Say
 Lifestyle · Food & Health4 Reasons to Eat Oatmeal, According to Nutrition Experts
 Lifestyle7 Signs Your Social Battery Is Running Low (and Why You Keep Cancelling Plans)