Berkeley Share Price Rises 0.39%: Up 3.8% in a Month
Technical analysis of Berkeley Group stock on November 18, 2026: price 3,578.07 GBp, trend sideways, RSI 54.7, support 3,420.00, resistance 3,770.00.

Trend and Price Action
The structure here is a consolidation inside a recovery. The last price of 3,578.07 GBp is fractionally below the 20-day average at 3,578.40 — effectively touching it — while the 50-day average at 3,407.80 sits comfortably beneath, and is itself rising. That the 20-day average climbed 1.45% over five sessions tells us the short-term trend is still pointing up even as price stalls, and the 20-day remains above the 50-day, keeping the broader alignment intact. No fresh moving-average cross has formed, so there is no new signal from that quarter — this is a stock that has already done its directional work and is now digesting it.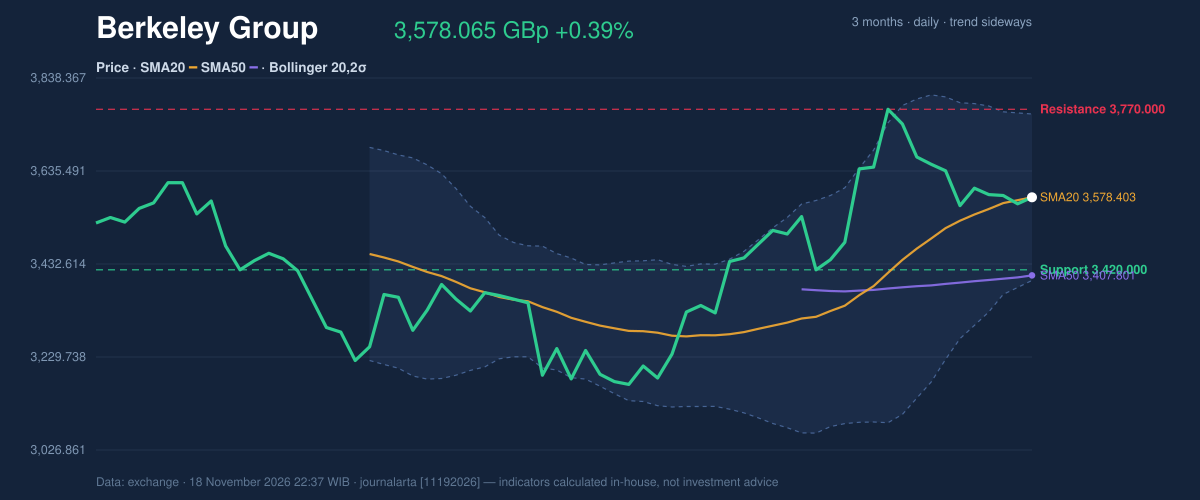
Oscillators and Momentum
Momentum is the weak link, and it is worth being precise about why. The RSI(14) at 54.7 is neutral in the most literal sense — neither stretched nor washed out — and Stochastic readings of %K 29.7 against %D 34.3 place the fast line in the lower third of its range without yet signalling a turn. On their own these would describe a market waiting.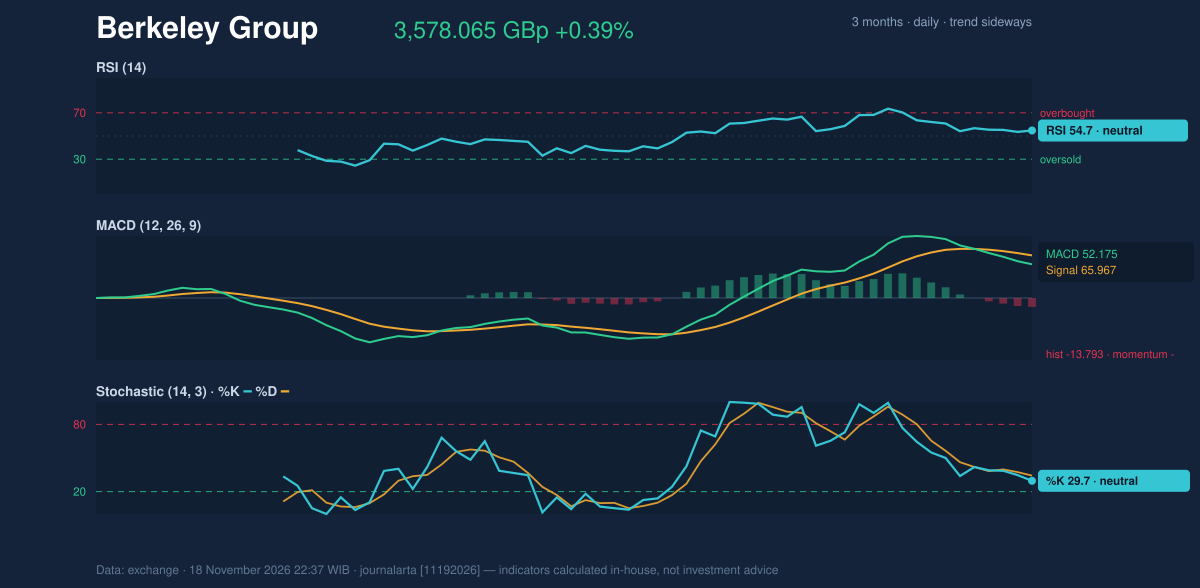
Volatility and Volume
The Bollinger configuration is textbook normal. Bands are 10.1% wide, the %B reading of 50% puts price at the exact midpoint of the channel, and the upper and lower bounds at 3,759.92 and 3,396.89 are neither compressed nor expanding aggressively. With the ATR(14) at 106.86 pence, or 3.0% of the price, volatility is moderate — large enough to produce meaningful daily swings, small enough that the bands are unlikely to be breached without a genuine shift in flows. The volume data is the part that demands the most interpretation. Wednesday's 54,857 shares traded against a 20-day average of 280,319 — 0.2 times normal, a genuinely thin session — and the on-balance volume line is declining. Thin volume in consolidation is not inherently bearish; it often means sellers have exhausted rather than that buyers are absent. But declining OBV alongside a flat price does say that participation is not confirming the uptrend, and a breakout on volume this light would carry little conviction.Key Levels and Scenarios
The near-term map is narrow. On the upside, resistance at 3,770.00 coincides almost exactly with the Bollinger upper band at 3,759.92 — a cluster that makes the mid-3,700s the first real test. A decisive close above that zone, ideally on volume returning toward the 280,000 average, would reopen the 3,872.00 three-month high. On the downside, support at 3,420.00 sits just above the 50-day average at 3,407.80 and the lower band at 3,396.89, forming a support shelf roughly 4% below the current price. A close below that cluster would break both the moving-average structure and the band floor simultaneously and invalidate the constructive reading.Technical Verdict: BUY
The verdict is BUY, supported by a research score of +66 on a −100 to +100 scale. Three reasons carry it: price holds above the 50-day average at 3,407.80; the 20-day average remains above the 50-day and is rising 1.45% over five sessions; and the RSI at 54.7 sits in the constructive 50-to-70 zone with room on both sides. The bearish case is real but secondary — the negative MACD histogram at −13.793 and declining OBV argue for patience on entry rather than abandonment of the trend. - Entry range: 3,497.83 – 3,578.07 (the 20-day average and the zone just below it) - Exit / target 1: 3,850.88; target 2: 4,123.69 - Stop loss: 3,396.19 — below the lower Bollinger band - Reward-to-risk: 1.5 to 3.0; setup valid until 16 December 2026 The verdict is invalidated if price closes below 3,396.19, where the 50-day average and lower band both give way. In plain terms: the trend is still up and the pullback looks orderly, but momentum and volume have not yet joined in — so this reads as a stock to accumulate on weakness with a hard floor rather than chase at current levels.Data Snapshot
| Indicator | Reading |
|---|---|
| Last price (18 Nov 2026) | 3,578.07 GBp (prev close 3,564.00) |
| Change 1 day / 5 days / 1 month | 0.39% / 0.51% / 3.83% |
| Trend | Sideways; SMA20 slope 1.45%/5 days; no new MA-cross |
| SMA20 / SMA50 | 3,578.40 / 3,407.80 — price below SMA20 |
| Bollinger (20,2σ) | Upper 3,759.92 / Mid 3,578.40 / Lower 3,396.89; %B 50%; width 10.1% |
| RSI(14) | 54.7 (neutral) |
| Stochastic | %K 29.7 / %D 34.3 (neutral) |
| MACD | 52.175 vs signal 65.967; histogram −13.793 |
| ATR(14) | 106.86 (3.0% of price) |
| Volume / average | 54,857 vs 280,319 (0.2×, thin); OBV declining |
| Support / Resistance (20h) | 3,420.00 / 3,770.00 (price at 45% of range) |
| 3-month high / low | 3,872.00 / 3,114.00 |
| Research score | +66 (BUY); 1 bullish signal vs 0 bearish |
This is technical analysis for educational purposes, not an investment recommendation. Levels are drawn from the data above; market conditions can change without notice.
Why Berkeley Group is in focus today
Selected automatically from 10 LSE (UK) stocks by a technical-signal score with daily weighted randomisation — not a recommendation.
Summary Data Berkeley Group
| Last price | 3,578.07 GBp |
| Change 1 day / 5 days / 1 month | 0.39% / 0.51% / 3.83% |
| Trend / MA-cross | sideways / none |
| SMA20 / SMA50 | 3,578.40 / 3,407.80 |
| RSI (14) / Stochastic %K | 54.7 / 29.7 |
| Bollinger %B / ATR | 50% / 106.86 |
| Support / Resistance 20 days | 3,420.00 / 3,770.00 |
| Data as of | 18 November 2026 22:37 WIB |
| JournalArta research verdict (score) | Buy (+66) |
| Entry zone | 3,497.827 – 3,578.065 |
| Target 1 / 2 | 3,850.876 / 4,123.687 |
| Stop loss | 3,396.191 |
| Reward/risk | 1.5 / 3.0 |
Today's full Buy and Sell list for UK, Singapore & Hong Kong stocks →
Disclaimer: This technical analysis is generated automatically from exchange data and indicators calculated by JournalArta, for information and education only. The verdict and the entry, target and stop-loss levels are not investment advice or a solicitation to buy or sell any security. Investment decisions and their risks rest solely with the reader.
Track Berkeley Group share price daily: live levels, support/resistance and our full Berkeley Group analysis history.
 Take the quizWhat Kind of Holiday Spender Are You? Take the Black Friday QuizStart →
- 1Gold Silver Price November: Futures Rise Near Yearly Lows

- 2U.S. Emergency Alert Test Nov. 17 Is Not a Power Outage

- 3Michael Clarke Says Sandpapergate Scars Drew Steve Smith to New York

- 42027 NFL Mock Draft Puts Ohio State’s Jeremiah Smith at No. 1

- 5GTA 6 New Zealand Time Trick Is Not Guaranteed to Work

 Lifestyle · Food & Health4 Reasons to Eat Oatmeal, According to Nutrition Experts
 Lifestyle7 Signs Your Social Battery Is Running Low (and Why You Keep Cancelling Plans)
 Lifestyle · Food & HealthThanksgiving Food Safety: How Long Leftovers Last and the Safe Turkey Temperature
 Lifestyle7 Quiet Habits of Emotionally Intelligent People, According to Psychologists