London Stock Exchange Share Price Latest: Falls 0.41% on Wednesday, Trading Volume 2.1x Normal
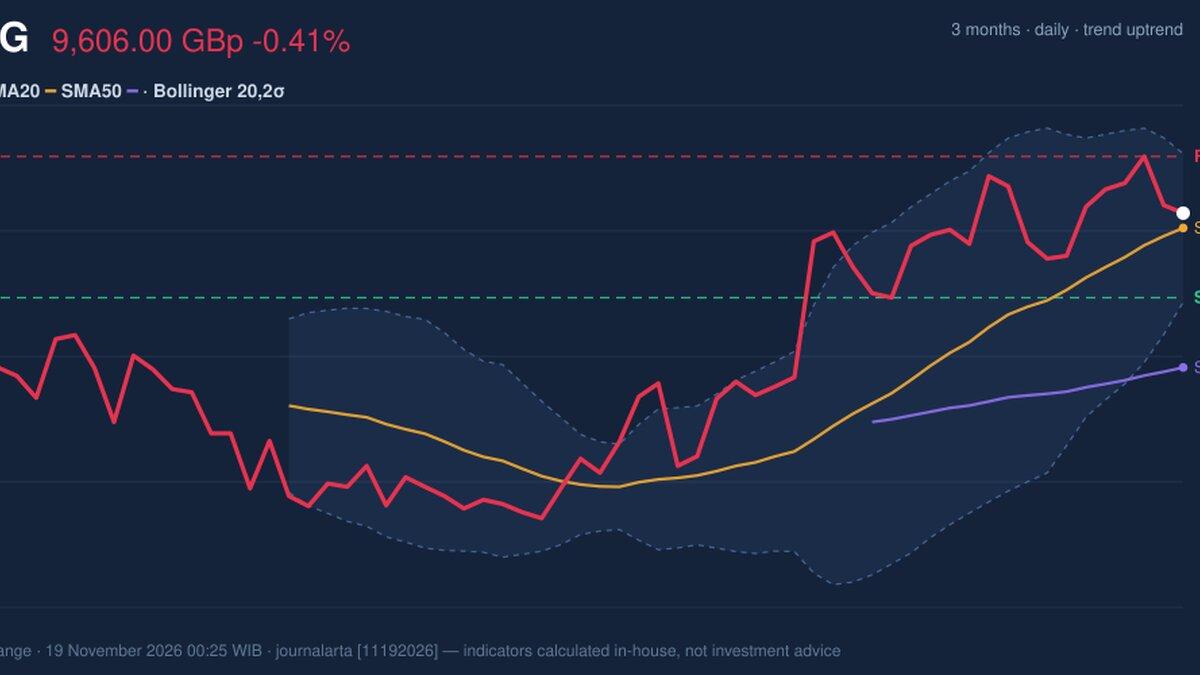
Technical analysis of LSEG stock on November 18, 2026: price 9,606.00 GBp, trend uptrend, RSI 58.1, support 9,186.00, resistance 9,888.00.
Why LSEG is in focus today
- Volume at 0.0× the 20-day average
Selected automatically from 10 LSE (UK) stocks by a technical-signal score with daily weighted randomisation — not a recommendation.
Trend & Price Action
The stock's structure is unambiguous. Price is above the 20-day average, which itself has risen 2.66% over the past five days, and the 20-day average sits above the 50-day. No fresh moving-average crossover occurred in the latest session, so this is a continuation pattern rather than a new regime. The 20-day average climbing at that pace is the mechanical footprint of higher lows — the market's way of telling you buyers have been willing to pay up over time.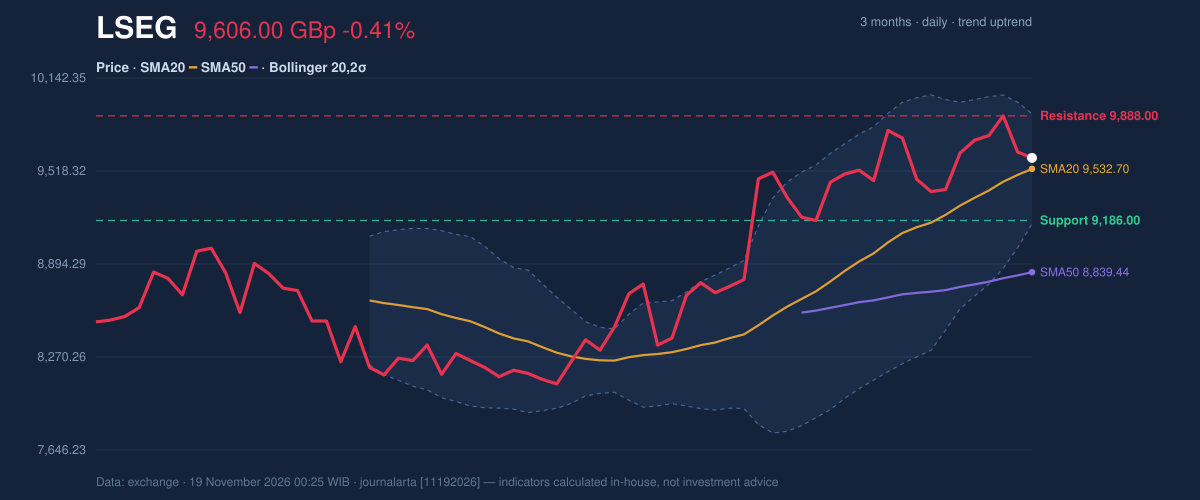
Oscillators & Momentum
Here the story turns. The Relative Strength Index sits at 58.1, squarely neutral, but its direction matters more than its level: it has rolled over from above 65, meaning upward pressure is easing. The Stochastic is similarly disengaged, with %K at 46.0 below the %D line at 64.1 — the fast line has slipped beneath the slow line, a soft signal that upward thrust is fading rather than reversing.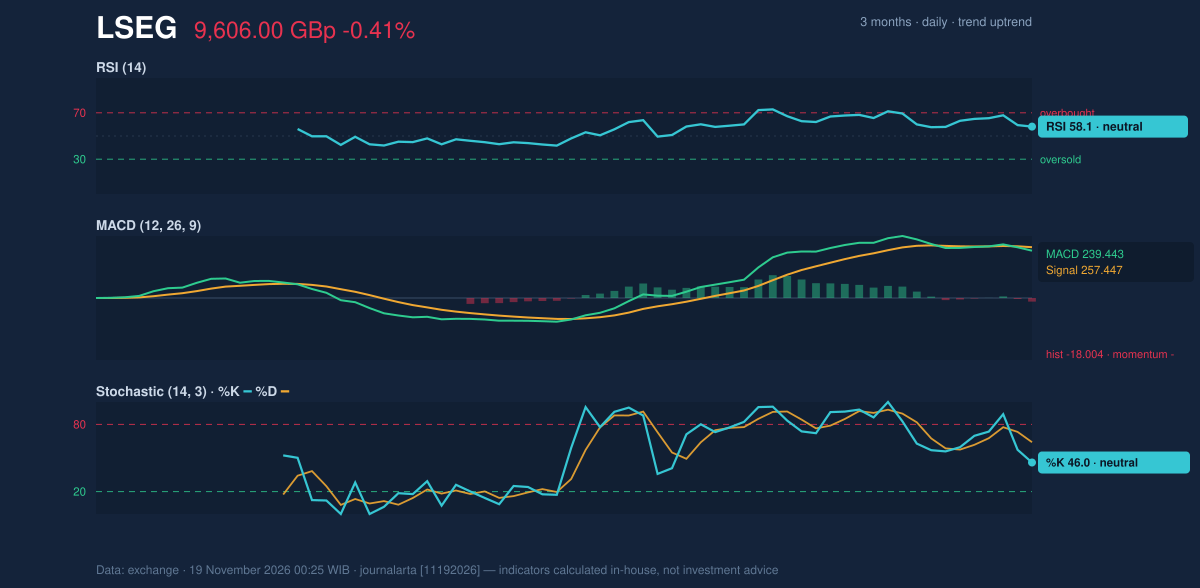
Volatility & Volume
The ATR of 226.07, or 2.4% of the price, describes moderate volatility: a normal day's swing is roughly a couple of hundred pence, which for a stock near 9,600 is meaningful but not disorderly. Combined with the Bollinger squeeze, this is a market that has not yet committed energy — and the wider the pause, the more decisive the resolution tends to be once it comes. Volume is the puzzle. The 2.1× surge arrived on a down day, yet the on-balance volume line is falling. Heavy participation accompanying a slip in price, with OBV confirming distribution, is a caution flag: the buyers who propelled the month's 9.28% gain are not in control of this particular session. For a non-trader, think of it as a crowded room where more people are quietly heading for the exit than the door.Key Levels & Scenarios
Two thresholds matter. On the upside, a close above the 20-day resistance of 9,888.00 would put the 3-month high at 9,980.00 — and the price-plus-1.5×ATR marker at 9,945.10 — firmly in play, turning the current squeeze into an expansion higher. On the downside, a break of the 20-day support at 9,186.00 would put the price-minus-1.5×ATR level of 9,266.90 under pressure, with the 3-month low at 8,012.00 the deeper reference if that fails. Between those rails, the stock is a coin waiting to land.Technical Verdict: HOLD (wait & see)
The code-driven JournalArta research verdict is HOLD, with a score of +45 on a −100 to +100 scale — below the +60 threshold for a buy and above the −60 floor for a sell. The reasons are structural: price sits above both its 20-day and 50-day averages and the averages are stacked bullishly; the pullback to the 20-day average is a classic trend-continuation setup; and the RSI at 58.1 remains in the neutral 50–70 zone. But the two bearish signals — the RSI rolling over from above 65 and the MACD histogram just turning negative — are precisely why the call is patience, not participation. - Entry Range (conditional): a close above 9,888.00 (20-day resistance) with volume confirmation, targeting 9,945.10–9,980.00 - Exit Target: 9,945.10 (price + 1.5×ATR), with 9,980.00 as the extended level - Stop Loss: below 9,186.00 (20-day support); a break invalidates the setup and reopens 9,266.90 as the next reference The verdict is invalidated if price breaks below 9,186.00 on sustained volume — at that point the uptrend structure itself would be under question. In plain English: the trend is still up and the pullback is orderly, but momentum has cooled enough that waiting for the market to pick its direction is the disciplined path. "The squeeze is the tell," one market participant noted on the close. "Nobody's wrong yet — but nobody's been paid for being early, either."Summary Data LSEG
| Last price | 9,606.00 GBp |
| Change 1 day / 5 days / 1 month | -0.41% / -0.33% / 9.28% |
| Trend / MA-cross | uptrend / none |
| SMA20 / SMA50 | 9,532.70 / 8,839.44 |
| RSI (14) / Stochastic %K | 58.1 / 46.0 |
| Bollinger %B / ATR | 60% / 226.07 |
| Support / Resistance 20 days | 9,186.00 / 9,888.00 |
| Data as of | 19 November 2026 00:25 WIB |
| JournalArta research verdict (score) | Hold (+45) |
Today's full Buy and Sell list for UK, Singapore & Hong Kong stocks →
Disclaimer: This technical analysis is generated automatically from exchange data and indicators calculated by JournalArta, for information and education only. The verdict and the entry, target and stop-loss levels are not investment advice or a solicitation to buy or sell any security. Investment decisions and their risks rest solely with the reader.
Track LSEG share price daily: live levels, support/resistance and our full LSEG analysis history.
 Take the quizWhat Kind of Holiday Spender Are You? Take the Black Friday QuizStart →
- 1Gold Silver Price November: Futures Rise Near Yearly Lows

- 2U.S. Emergency Alert Test Nov. 17 Is Not a Power Outage

- 3Michael Clarke Says Sandpapergate Scars Drew Steve Smith to New York

- 42027 NFL Mock Draft Puts Ohio State’s Jeremiah Smith at No. 1

- 5GTA 6 New Zealand Time Trick Is Not Guaranteed to Work

 Lifestyle · Food & Health4 Reasons to Eat Oatmeal, According to Nutrition Experts
 Lifestyle7 Signs Your Social Battery Is Running Low (and Why You Keep Cancelling Plans)
 Lifestyle · Food & HealthThanksgiving Food Safety: How Long Leftovers Last and the Safe Turkey Temperature
 Lifestyle7 Quiet Habits of Emotionally Intelligent People, According to Psychologists