Zip Share Price on Wednesday: Slides 2.09%, Down 13.8% in Five Sessions
Technical analysis of Zip stock on November 18, 2026: price 1.87 AUD, trend downtrend, RSI 44.3, support 1.46, resistance 2.17.

Why Zip is in focus today
- One-day move of 0.00%, about 0.0× its average daily range (ATR)
Selected automatically from 9 ASX (Australia) stocks by a technical-signal score with daily weighted randomisation — not a recommendation.
Trend and Price Action
The structure is unambiguously weak. At A$1.87, Zip sits below its 20-day average of A$1.91 and well under its 50-day average of A$2.04, and the 20-day average itself is sloping down, falling 1.95% over the past five sessions. That combination — price under the short average, short average under the long average, both drifting lower — is the textbook definition of a downtrend, and it is the single most important fact in this data set. There is no fresh moving-average cross to flag; the bearish alignment was already in place before this session and has simply persisted. What the price action shows is a stock in the lower-middle of its recent range: the current level sits at roughly 58% of the distance between the 20-day support of A$1.46 and 20-day resistance of A$2.17. Against the wider three-month span of A$1.02 to A$3.11, Zip has given back a large share of its earlier advance and is now consolidating in the middle of that band rather than testing either extreme.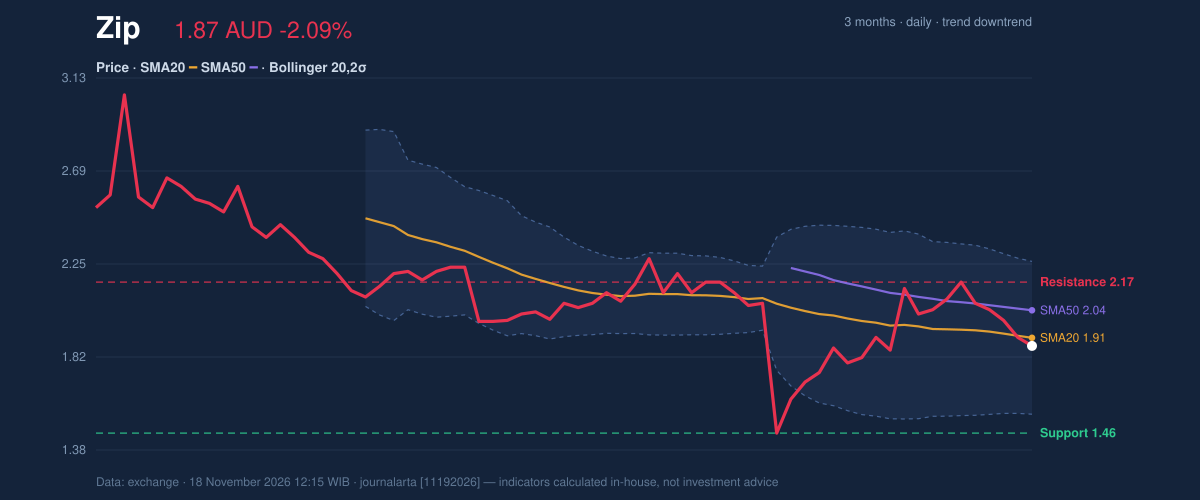
Oscillators and Momentum
Momentum is mixed, and that is the more interesting signal. The RSI(14) at 44.3 is neutral, sitting in the 30-to-50 zone that typically describes a market leaning bearish without being oversold — there is room to fall further before a washout condition registers. Stochastic readings tell a similar story: %K at 26.7 against %D at 39.3 shows the faster line below the slower one, consistent with recent weakness, but both are near the lower end of their range rather than pinned at zero. The divergence is in the MACD. The MACD line at -0.017 sits above its signal at -0.022, producing a positive histogram of 0.005. In plain terms, the downward momentum is decelerating even as price grinds lower — the gap between the two lines is narrowing in the bullish direction. That is not a buy signal on its own, and it is far too early to call a reversal, but it does argue that the selling pressure is easing rather than accelerating.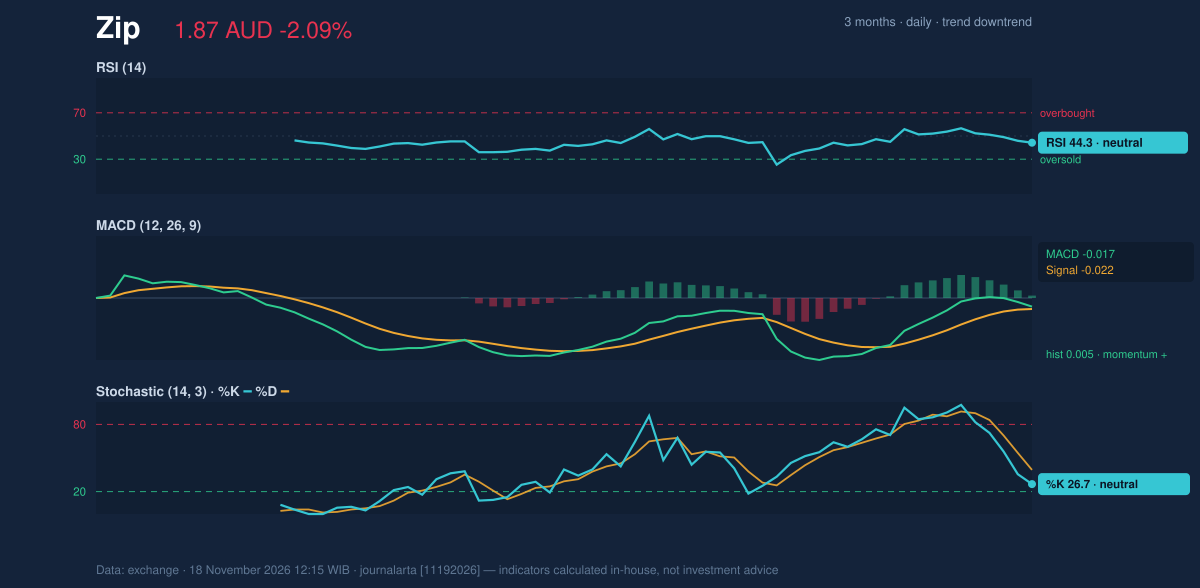
Volatility and Volume
Volatility is running hot. The average true range of A$0.13 equals 7.2% of the share price, meaning a typical day now moves Zip by more than seven cents — a large swing for a stock in this price band. Bollinger bands confirm the expansion: the upper band sits at A$2.27 and the lower at A$1.55, a width of 37.7% that is widening, the signature of a high-volatility regime rather than a coiled spring. Position within those bands is the tell. The %B reading of 45% places Zip slightly below the middle of the band — not near the lower rail where a mean-reversion bounce would be most likely, and not near the upper rail where a breakout would be credible. The stock is, quite literally, in no-man's land. Volume reinforces the caution. Last session's turnover of 15.2 million shares was just 0.5× the 20-day average of 27.8 million — half normal participation — and on-balance volume is trending down. A decline on shrinking volume can mean sellers are exhausted; it can equally mean buyers have simply walked away. The falling OBV tilts the interpretation toward the latter, and it is one of the two bearish signals the technical screen registers.Key Levels and Scenarios
The levels that matter are clear. On the upside, resistance at A$2.17 is the 20-day ceiling; a close above it would be the first evidence that the downtrend is being challenged, and the price-plus-1.5×ATR reference of A$2.07 sits just beneath it as an initial waypoint. On the downside, support at A$1.46 is the line that has held the range; the price-minus-1.5×ATR reference of A$1.67 is the nearer marker to watch for any break of the current consolidation. If price holds above A$1.67 and pushes through A$2.07, the setup shifts toward a range-recovery attempt. If it loses A$1.67 and then A$1.46, the three-month low of A$1.02 comes into view as the next reference. Neither scenario is confirmed today.Technical Verdict: HOLD (wait & see)
The call is HOLD (wait & see), and the reasoning is structural rather than directional. First, the trend is decisively negative — price below the 50-day average, the 20-day average below the 50-day, a 13.82% five-day decline and falling OBV. Second, momentum is only tentatively improving, with the MACD histogram positive but the RSI still in the bearish 30-to-50 zone. Third, the stock sits mid-band at 45% %B, offering no high-probability entry edge in either direction. The screen records zero bullish signals against two bearish ones and a score of -76 on a -100 to +100 scale. The stop required to trade this setup would sit too far from the current price to justify the risk, which is precisely why the call stays on hold.- Upside scenario (conditional): A close above 20-day resistance at A$2.17 opens a path toward the upper Bollinger band at A$2.27, with A$2.07 as the first reference on the way.
- Downside scenario (conditional): A break of 20-day support at A$1.46, with A$1.67 as the earlier warning level, puts the three-month low of A$1.02 in play.
- Stop reference for any position: the price-minus-1.5×ATR level of A$1.67 on the downside, or invalidation of the bearish case on a sustained move above A$2.17.
Summary Data Zip
| Last price | 1.87 AUD |
| Change 1 day / 5 days / 1 month | -2.09% / -13.82% / -9.22% |
| Trend / MA-cross | downtrend / none |
| SMA20 / SMA50 | 1.91 / 2.04 |
| RSI (14) / Stochastic %K | 44.3 / 26.7 |
| Bollinger %B / ATR | 45% / 0.13 |
| Support / Resistance 20 days | 1.46 / 2.17 |
| Data as of | 18 November 2026 12:15 WIB |
| JournalArta research verdict (score) | Hold (-76) |
Today's full Buy and Sell list for Australian stocks (ASX) →
Disclaimer: This technical analysis is generated automatically from exchange data and indicators calculated by JournalArta, for information and education only. The verdict and the entry, target and stop-loss levels are not investment advice or a solicitation to buy or sell any security. Investment decisions and their risks rest solely with the reader.
Track Zip share price daily: live levels, support/resistance and our full Zip analysis history.
 Take the quizWhat Kind of Holiday Spender Are You? Take the Black Friday QuizStart →
- 1U.S. Emergency Alert Test Nov. 17 Is Not a Power Outage

- 2Gold Silver Price November: Futures Rise Near Yearly Lows

- 3Michael Clarke Says Sandpapergate Scars Drew Steve Smith to New York

- 4GTA 6 New Zealand Time Trick Is Not Guaranteed to Work

- 52027 NFL Mock Draft Puts Ohio State’s Jeremiah Smith at No. 1

 Lifestyle · Food & Health4 Reasons to Eat Oatmeal, According to Nutrition Experts
 Lifestyle7 Signs Your Social Battery Is Running Low (and Why You Keep Cancelling Plans)
 Lifestyle · Food & HealthThanksgiving Food Safety: How Long Leftovers Last and the Safe Turkey Temperature
 Lifestyle7 Quiet Habits of Emotionally Intelligent People, According to Psychologists