Reckitt Benckiser Share Price on Wednesday: Falls 0.66%, Up 5% in a Month
Technical analysis of Reckitt stock on November 18, 2026: price 5,704.00 GBp, trend uptrend, RSI 61.8, support 5,218.00, resistance 5,778.00.

Why Reckitt is in focus today
Selected automatically from 10 LSE (UK) stocks by a technical-signal score with daily weighted randomisation — not a recommendation.
Trend & Price Action
The structural case rests on two numbers. The stock sits at 5,704.00 GBp, above its 20-day average of 5,559.50, which in turn sits above the 50-day average of 5,286.58 — the classic stacked alignment of a healthy uptrend. No new moving-average crossover was registered, so this is a continuation setup rather than a fresh signal; the trend was already in place, and the latest session simply tested it. The 20-day average itself rose 0.99% over five days, confirming the slope is still pointing higher rather than flattening out.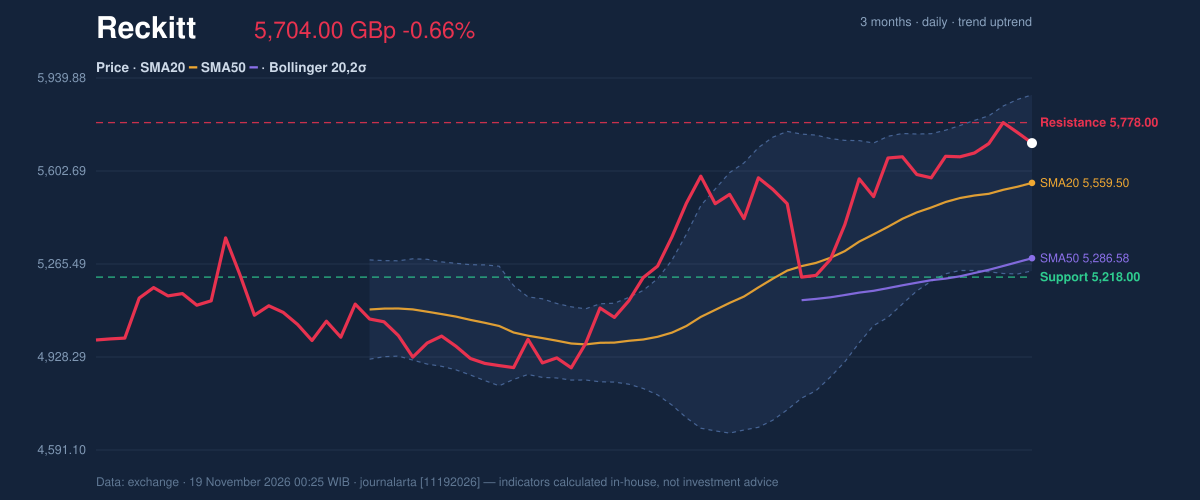
Oscillators & Momentum
Momentum is positive but no longer unambiguously so, and that nuance is the most useful signal here. MACD stands at 123.637 against a signal line of 119.622, with a histogram of 4.015 — still in positive territory, meaning the faster average remains above the slower one, but the margin is thin enough to suggest the impulse is cooling rather than accelerating. RSI(14) at 61.8 sits in the neutral 50-to-70 zone: firm, consistent with an uptrend, but not stretched. The bearish flag is subtler — RSI is rolling over from above 65, a pattern that often precedes short-term consolidation rather than a reversal when the underlying trend is intact.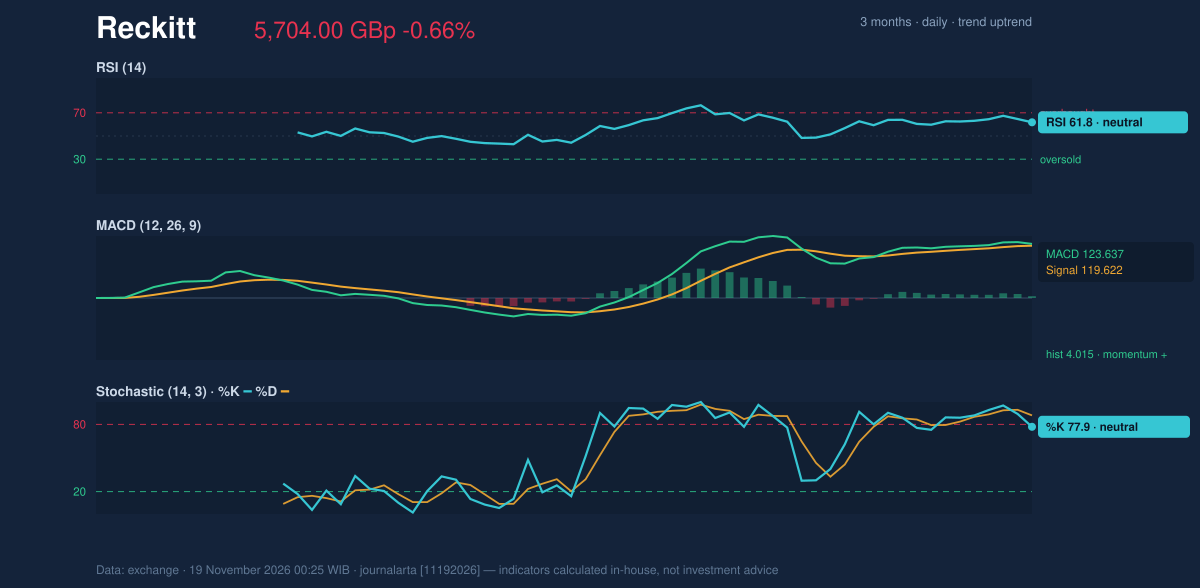
Volatility & Volume
Bollinger bands frame the risk neatly. The %B reading of 73% puts price in the upper half of the band, between the middle at 5,559.50 and the upper band at 5,878.57, while the lower band sits at 5,240.43. Band width of 11.5% is classified as normal — neither a squeeze nor an expansion — so there is no coiled-spring setup suggesting an imminent explosive move. The ATR of 132.07, or 2.3% of price, describes moderate daily volatility: a typical session moves the stock around 132 points, which puts the 74-point gap to resistance within a single day's range. Volume supports the trend more than the price action does. Rising OBV — on-balance volume, which adds volume on up-days and subtracts it on down-days — confirms that buyers have been the dominant participants over the period, even as the latest session saw distribution. Heavy volume on a down-day inside an uptrend is a caution, but a single session does not undo a cumulative buying pattern.Technical Verdict: BUY
The evidence tilts bullish on three grounds: price above the 50-day average at 5,286.58 with the 20-day average above the 50-day, the definitional signature of an uptrend; an uptrend confirmed by rising OBV, showing participation behind the move; and RSI at 61.8, which leaves room for further gains before overbought conditions bite. The verdict is invalidated if price breaks below the stop loss at 5,479.03, which would undercut the pullback-to-the-20-day-average thesis. Entry Range: 5,604.76 – 5,704.00 Exit/Target 1: 6,041.45 Exit/Target 2: 6,378.91 Stop Loss: 5,479.03 Reward/risk is 1.5 to target 1 and 3.0 to target 2, valid until December 17, 2026. For the general reader: the technical picture says the stock's underlying climb is still intact, but the recent stall and the RSI rollover mean this is a moment for discipline on entry levels rather than chasing the move — a setup where the trend is the friend, but the price is the risk.Data Snapshot
| Last Price | 5,704.00 GBp |
| 1-Day / 5-Day / 1-Month | -0.66% / 0.88% / 5.05% |
| SMA20 / SMA50 | 5,559.50 / 5,286.58 |
| Bollinger Upper / Mid / Lower | 5,878.57 / 5,559.50 / 5,240.43 (%B 73%, width 11.5%) |
| RSI(14) | 61.8 (neutral) |
| Stochastic %K / %D | 77.9 / 88.0 |
| MACD / Signal / Histogram | 123.637 / 119.622 / 4.015 |
| ATR(14) | 132.07 (2.3%) |
| Volume vs 20-day avg | 1,796,463 vs 1,377,210 (1.3×) |
| Support / Resistance (20h) | 5,218.00 / 5,778.00 |
| 3-Month High / Low | 5,808.00 / 4,850.00 |
| Session | Wednesday, November 18, 2026 |
Summary Data Reckitt
| Last price | 5,704.00 GBp |
| Change 1 day / 5 days / 1 month | -0.66% / 0.88% / 5.05% |
| Trend / MA-cross | uptrend / none |
| SMA20 / SMA50 | 5,559.50 / 5,286.58 |
| RSI (14) / Stochastic %K | 61.8 / 77.9 |
| Bollinger %B / ATR | 73% / 132.07 |
| Support / Resistance 20 days | 5,218.00 / 5,778.00 |
| Data as of | 19 November 2026 00:25 WIB |
| JournalArta research verdict (score) | Buy (+76) |
| Entry zone | 5,604.76 – 5,704.00 |
| Target 1 / 2 | 6,041.45 / 6,378.91 |
| Stop loss | 5,479.03 |
| Reward/risk | 1.5 / 3.0 |
Today's full Buy and Sell list for UK, Singapore & Hong Kong stocks →
Disclaimer: This technical analysis is generated automatically from exchange data and indicators calculated by JournalArta, for information and education only. The verdict and the entry, target and stop-loss levels are not investment advice or a solicitation to buy or sell any security. Investment decisions and their risks rest solely with the reader.
Track Reckitt share price daily: live levels, support/resistance and our full Reckitt analysis history.
 Take the quizWhat Kind of Holiday Spender Are You? Take the Black Friday QuizStart →
- 1Gold Silver Price November: Futures Rise Near Yearly Lows

- 2U.S. Emergency Alert Test Nov. 17 Is Not a Power Outage

- 3Michael Clarke Says Sandpapergate Scars Drew Steve Smith to New York

- 42027 NFL Mock Draft Puts Ohio State’s Jeremiah Smith at No. 1

- 5GTA 6 New Zealand Time Trick Is Not Guaranteed to Work

 Lifestyle · Food & Health4 Reasons to Eat Oatmeal, According to Nutrition Experts
 Lifestyle7 Signs Your Social Battery Is Running Low (and Why You Keep Cancelling Plans)
 Lifestyle · Food & HealthThanksgiving Food Safety: How Long Leftovers Last and the Safe Turkey Temperature
 Lifestyle7 Quiet Habits of Emotionally Intelligent People, According to Psychologists