Aviva Share Price Falls 1.01% (November 18, 2026): Up 4% in a Month
Technical analysis of Aviva stock on November 18, 2026: price 742.60 GBp, trend uptrend, RSI 55.8, support 711.20, resistance 764.80.
Why Aviva is in focus today
Selected automatically from 10 LSE (UK) stocks by a technical-signal score with daily weighted randomisation — not a recommendation.
Trend & Price Action
Position within the range matters more than the headline move. The shares are in the upper half of their 20-day band, 59% of the way between support at 711.20p and resistance at 764.80p. The three-month high of 768.60p and low of 668.60p frame a stock that has clawed back most of its autumn weakness but has not yet broken out. That ceiling near 764.80p coincides closely with the upper Bollinger band at 764.27p — two independent measures of the same obstacle, which makes it a level worth respecting rather than rounding past.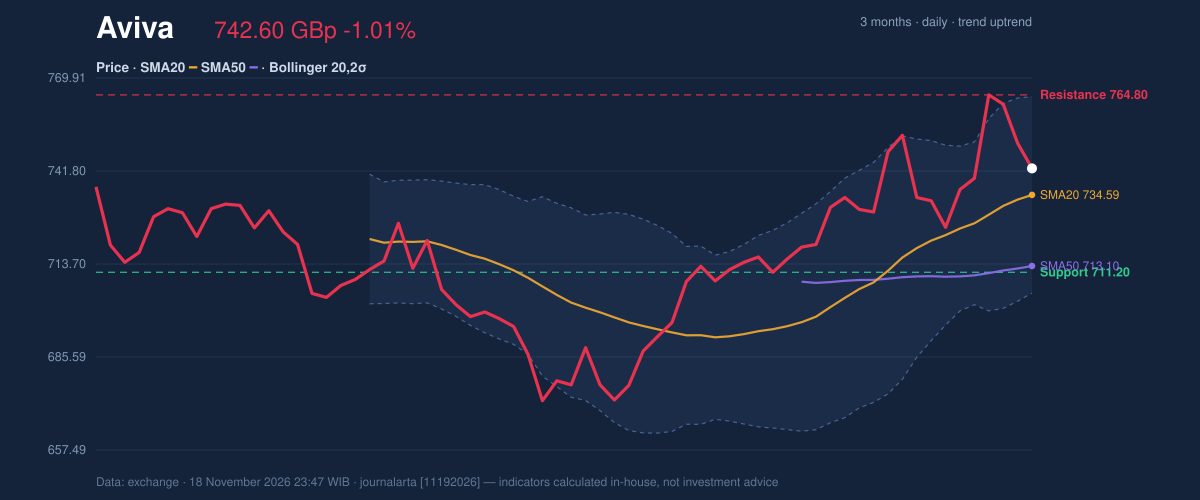
Oscillators & Momentum
Momentum is cooling rather than cracking. RSI(14) at 55.8 is squarely neutral — neither stretched nor exhausted, and comfortably clear of the 70 line that would signal overheating. The more telling reading is the bearish counter-signal: RSI rolling over from above 65. That is the fingerprint of a rally losing a little thrust, not of a trend reversing. The Stochastic adds a second caution. %K at 42.2 sits below %D at 63.0, a configuration that typically precedes short-term softness.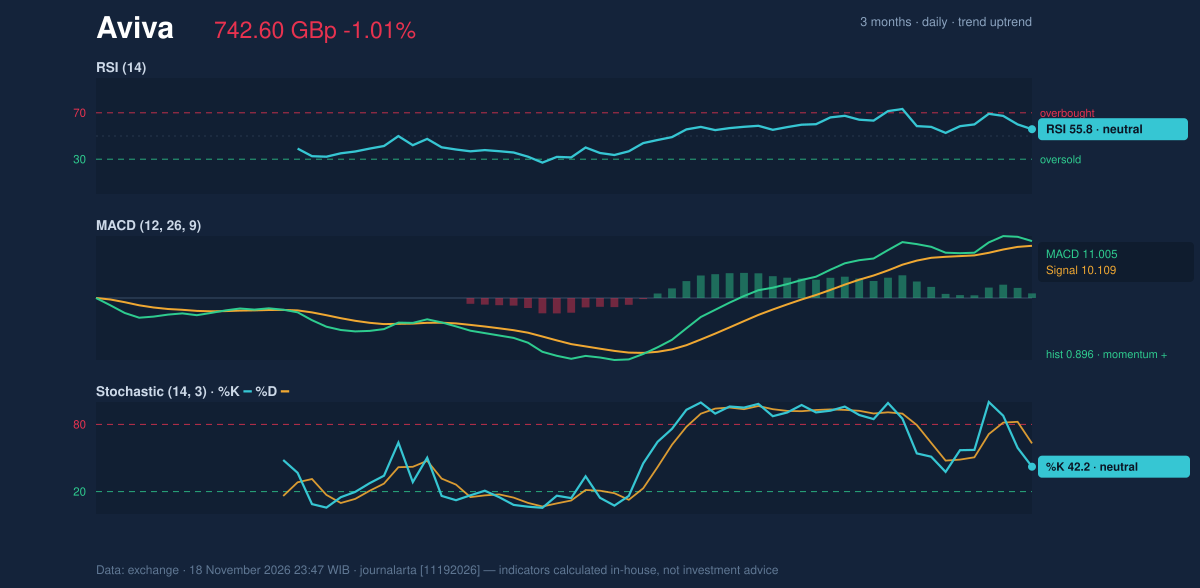
Volatility & Volume
Bollinger width of 8.1% is normal, neither squeezed nor expanded, and %B at 63% places the price in the upper-middle of the band. ATR of 13.77 points, or 1.9% of the price, describes moderate volatility — roughly £14 of average daily travel. For a general reader: bands this wide mean the stock has room to drift in either direction without anything dramatic being implied. Volume is where the caution bites. Last session moved 4.50 million shares against a 20-day average of 5.71 million — just 0.8× normal — and On-Balance Volume is falling. The accumulation measure declining while price edges higher is the weakest combination on the page, and it explains why the day's 1.01% fall deserves attention rather than dismissal.Key Levels & Scenarios
The levels are unusually clean. On the downside, 711.20p is the 20-day support, sitting just above the 50-day average at 713.10p — a cluster that should absorb ordinary pullbacks. Below that, 704.91p marks the lower Bollinger band. On the upside, 764.80p is the 20-day resistance, backed by the 768.60p three-month high; a close above both would open the path implied by the upper band structure. If the stock holds 711.20p, the uptrend narrative survives intact. If it fails there, the 50-day average comes into play immediately.Technical Verdict: BUY
The verdict is BUY, carrying a computed score of +68 on a −100 to +100 scale, where +60 or above reads as a buy. Three reasons carry the weight: price trades above its 50-day average, the 20-day average itself sits above the 50-day, and the trend is rising with RSI at 55.8 in the healthy 50–70 zone. The fading oscillators and falling OBV are real risks, but they argue for patience on entry rather than a change of direction. - Entry zone: 732.30p – 742.60p - Exit targets: 793.82p and 845.05p - Stop loss: 708.45p - Reward-to-risk: 1.5 to 3.0 - Validity: through 16 December 2026 The verdict is invalidated if price breaks below 708.45p, which would undercut the support cluster and the lower band together. In plain English: the trend is intact and the setup favours holders, but the stock is pausing, not surging. The next scheduled event to watch is the 16 December validity date on these levels; until then, the market's own test comes at each close relative to 764.80p above and 711.20p below.Market Data Snapshot
| Last Price | 742.60 GBp |
| 1-Day / 5-Day / 1-Month Change | -1.01% / 0.87% / 3.98% |
| SMA20 / SMA50 | 734.59 / 713.10 |
| Bollinger (20,2σ) | Upper 764.27 / Mid 734.59 / Lower 704.91; Width 8.1% |
| RSI(14) | 55.8 (neutral) |
| Stochastic %K / %D | 42.2 / 63.0 |
| MACD / Signal / Histogram | 11.005 / 10.109 / 0.896 |
| ATR(14) | 13.77 (1.9% of price) |
| Volume vs 20-day Average | 4,500,649 vs 5,712,289 (0.8×) |
| 20-Day Support / Resistance | 711.20 / 764.80 |
| 3-Month High / Low | 768.60 / 668.60 |
| JournalArta Research Score | +68 (BUY) |
Summary Data Aviva
| Last price | 742.60 GBp |
| Change 1 day / 5 days / 1 month | -1.01% / 0.87% / 3.98% |
| Trend / MA-cross | uptrend / none |
| SMA20 / SMA50 | 734.59 / 713.10 |
| RSI (14) / Stochastic %K | 55.8 / 42.2 |
| Bollinger %B / ATR | 63% / 13.77 |
| Support / Resistance 20 days | 711.20 / 764.80 |
| Data as of | 18 November 2026 23:47 WIB |
| JournalArta research verdict (score) | Buy (+68) |
| Entry zone | 732.30 – 742.60 |
| Target 1 / 2 | 793.82 / 845.05 |
| Stop loss | 708.45 |
| Reward/risk | 1.5 / 3.0 |
Today's full Buy and Sell list for UK, Singapore & Hong Kong stocks →
Disclaimer: This technical analysis is generated automatically from exchange data and indicators calculated by JournalArta, for information and education only. The verdict and the entry, target and stop-loss levels are not investment advice or a solicitation to buy or sell any security. Investment decisions and their risks rest solely with the reader.
Track Aviva share price daily: live levels, support/resistance and our full Aviva analysis history.
 Take the quizWhat Kind of Holiday Spender Are You? Take the Black Friday QuizStart →
- 1Gold Silver Price November: Futures Rise Near Yearly Lows

- 2U.S. Emergency Alert Test Nov. 17 Is Not a Power Outage

- 3Michael Clarke Says Sandpapergate Scars Drew Steve Smith to New York

- 42027 NFL Mock Draft Puts Ohio State’s Jeremiah Smith at No. 1

- 5GTA 6 New Zealand Time Trick Is Not Guaranteed to Work

 Lifestyle · Food & Health4 Reasons to Eat Oatmeal, According to Nutrition Experts
 Lifestyle7 Signs Your Social Battery Is Running Low (and Why You Keep Cancelling Plans)
 Lifestyle · Food & HealthThanksgiving Food Safety: How Long Leftovers Last and the Safe Turkey Temperature
 Lifestyle7 Quiet Habits of Emotionally Intelligent People, According to Psychologists