British Land Share Price on Wednesday: Rises 1.62%, Up 2.2% in Five Sessions
Technical analysis of British Land stock on November 18, 2026: price 439.00 GBp, trend uptrend, RSI 64.1, support 415.20, resistance 439.00.
Why British Land is in focus today
Selected automatically from 10 LSE (UK) stocks by a technical-signal score with daily weighted randomisation — not a recommendation.
Trend & Price Action
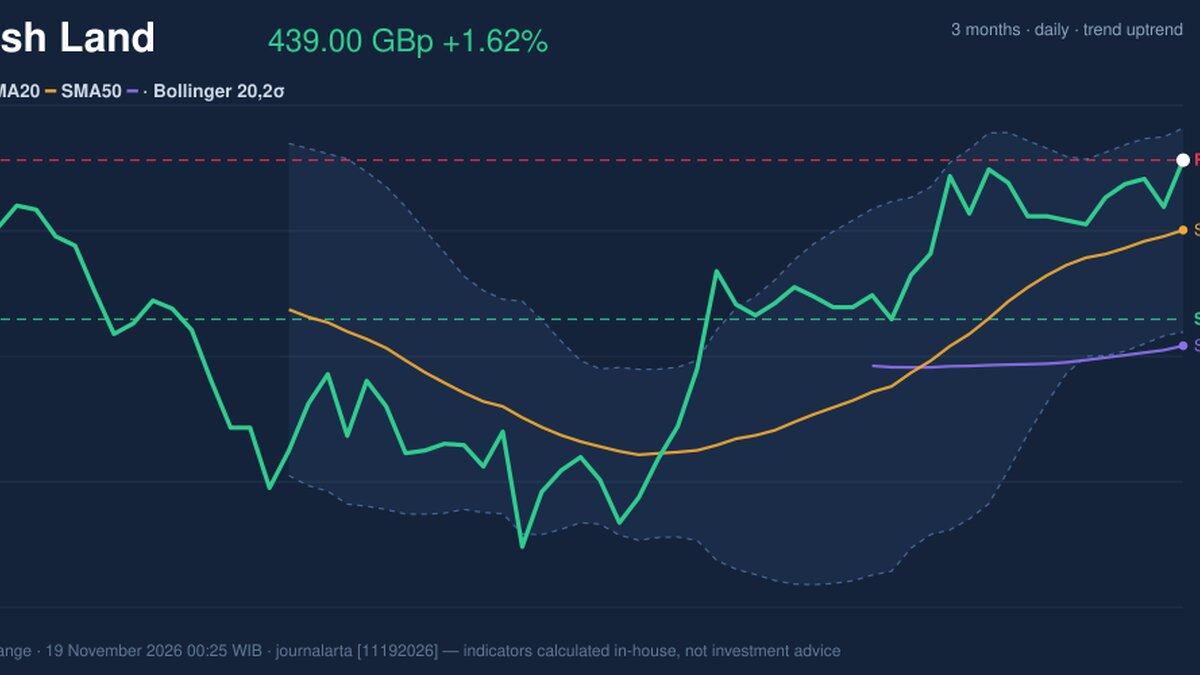
The structure is a clean, orderly advance. British Land trades above its 20-day average of 428.54 GBp, which in turn sits above the 50-day average of 411.25 GBp — the classic stack that defines an uptrend for general readers: each time frame is confirming the one below it. The 20-day average rose 0.98% over the past five sessions, a gentle, persistent slope rather than a vertical spike. Over the trailing windows the stock added 2.24% in five days and 4.52% in a month, so momentum is building without becoming stretched. There is no fresh moving-average cross to report; the bullish alignment has been in place, not newly minted. The three-month high of 447.00 GBp sits just 1.8% above the intraday close, and the low of 380.00 GBp is well behind. That places the shares in the upper quarter of their quarterly range — a sign of demand, but also the zone where sellers historically re-appear.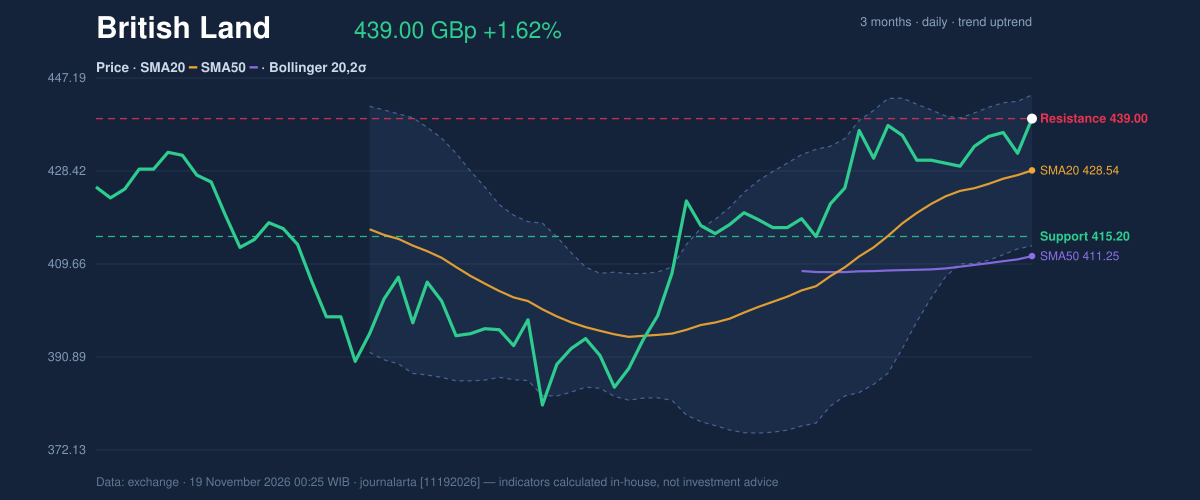
Oscillators & the One Warning Sign
Momentum is constructive but not euphoric. The 14-day RSI at 64.1 is in neutral territory — technically below the 70 line that flags overbought conditions — which means the rally has room before it is technically exhausted. Stochastic readings of %K 70.1 against %D 62.7 are similarly neutral, with the faster line above the slower one, a mild positive tilt. The exception is MACD. Its line at 6.646 has slipped marginally below its signal line at 6.707, leaving a histogram of −0.061. That is the one bearish signal in the data set, and it matters in interpretation: it suggests the pace of the advance has flattened even as price makes highs. Divergence of this kind is often a pause, not a reversal — especially when RSI is not overbought — but it is the reason to demand confirmation from price rather than assume the breakout.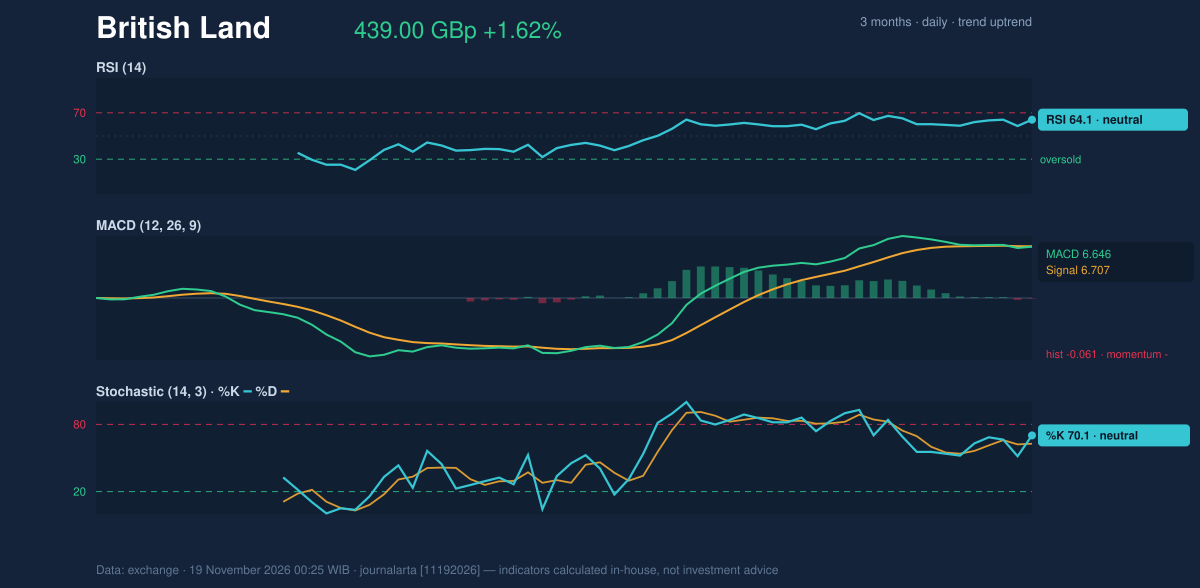
Volatility, Bands & Volume
The Bollinger bands are tightening. The 20-day band spans 413.30 to 443.78 GBp, a width of 7.1%, and the data describe this as a squeeze — a period of compressed volatility that statistically tends to resolve in a directional move. The stock's %B reading of 84% means it is trading in the upper fifth of the band, close to the 443.78 GBp upper rail. Average true range of 9.39 GBp, about 2.1% of the price, is moderate volatility. Combined with the squeeze, the setup implies a market coiling rather than one trending smoothly — moves could be sharp when they come. Volume is the tiebreaker here, and it leans bullish: the latest session's turnover and the rising OBV both indicate buyers are positioned for a resolution higher.Key Levels & Scenarios
The pivotal level is 439.00 GBp, the 20-day resistance and the current price. A decisive close above it would confirm the squeeze resolving upward and open the path toward the three-month high of 447.00 GBp. Failure to hold this area would send the stock back into the range, with first support at the 20-day average of 428.54 GBp, then the lower band near 413.30 GBp.Technical Verdict: BUY
The JournalArta research model scores British Land at +76 on a −100 to +100 scale — comfortably above the +60 buy threshold — on three drivers: price above the 50-day average, the 20-day average above the 50-day, and RSI at 64.1 in the 50–70 zone. The two bullish signals are a pullback to the 20-day average within an uptrend and an uptrend confirmed by rising OBV. The lone bearish flag, the MACD histogram turning negative, is the main risk to monitor. - Entry zone: 431.96 – 439.00 GBp - Target 1: 462.97 GBp - Target 2: 486.94 GBp - Stop loss: 423.02 GBp - Reward-to-risk: 1.5 to 3.0; setup valid until December 17, 2026. The verdict is invalidated if price breaks below 423.02 GBp. In plain English: the trend, volume and momentum backdrop favour further gains, provided the stock keeps its footing above the low 430s. The next scheduled event is the expiry of this setup on December 17, 2026, unless price resolves the range first.Summary Data British Land
| Last price | 439.00 GBp |
| Change 1 day / 5 days / 1 month | 1.62% / 2.24% / 4.52% |
| Trend / MA-cross | uptrend / none |
| SMA20 / SMA50 | 428.54 / 411.25 |
| RSI (14) / Stochastic %K | 64.1 / 70.1 |
| Bollinger %B / ATR | 84% / 9.39 |
| Support / Resistance 20 days | 415.20 / 439.00 |
| Data as of | 19 November 2026 00:25 WIB |
| JournalArta research verdict (score) | Buy (+76) |
| Entry zone | 431.96 – 439.00 |
| Target 1 / 2 | 462.97 / 486.94 |
| Stop loss | 423.02 |
| Reward/risk | 1.5 / 3.0 |
Today's full Buy and Sell list for UK, Singapore & Hong Kong stocks →
Disclaimer: This technical analysis is generated automatically from exchange data and indicators calculated by JournalArta, for information and education only. The verdict and the entry, target and stop-loss levels are not investment advice or a solicitation to buy or sell any security. Investment decisions and their risks rest solely with the reader.
Track British Land share price daily: live levels, support/resistance and our full British Land analysis history.
 Take the quizWhat Kind of Holiday Spender Are You? Take the Black Friday QuizStart →
- 1Gold Silver Price November: Futures Rise Near Yearly Lows

- 2U.S. Emergency Alert Test Nov. 17 Is Not a Power Outage

- 3Michael Clarke Says Sandpapergate Scars Drew Steve Smith to New York

- 42027 NFL Mock Draft Puts Ohio State’s Jeremiah Smith at No. 1

- 5GTA 6 New Zealand Time Trick Is Not Guaranteed to Work

 Lifestyle · Food & Health4 Reasons to Eat Oatmeal, According to Nutrition Experts
 Lifestyle7 Signs Your Social Battery Is Running Low (and Why You Keep Cancelling Plans)
 Lifestyle · Food & HealthThanksgiving Food Safety: How Long Leftovers Last and the Safe Turkey Temperature
 Lifestyle7 Quiet Habits of Emotionally Intelligent People, According to Psychologists