Southern Stock Rises 0.87% (November 18, 2026): Up 4.4% in a Month
Technical analysis of Southern Company stock on November 18, 2026: price 94.41 USD, trend uptrend, RSI 59.8, support 91.52, resistance 94.64.

Why Southern Company is in focus today
Selected automatically from 11 NYSE (US) stocks by a technical-signal score with daily weighted randomisation — not a recommendation.
Trend & Price Action
The bigger picture confirms it. Southern's price sits well above its 50-day average of 89.03, and the 20-day average itself is above the 50-day — a stance that typically signals buyers in control over the medium term. There is no new moving-average crossover to report: the setup has been in place rather than forming on this session. What matters more for readers watching the chart is where the stock sits inside its recent range. Wednesday's close left the shares at 93% of the 20-day range, with support at 91.52 and resistance at 94.64 — a level the stock is now knocking against. The three-month high of 95.72 and low of 81.69 frame how far the recovery has run.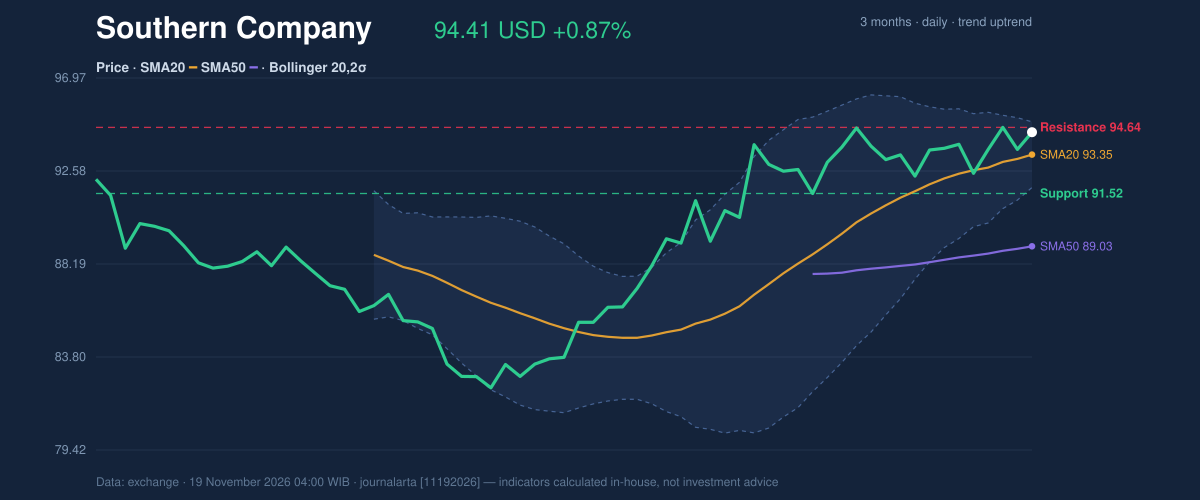
Momentum: Running Strong, but Not in the Clear
Momentum is the mixed part of the story. The relative strength index (RSI, a 0–100 measure of buying intensity) reads 59.8 — neutral, meaning the advance has not stretched into overbought territory where the rally would look exhausted. The stochastic oscillator, which compares the close to its recent range, is also neutral, at %K 75.4 against %D 71.7. Yet the MACD — a trend-following gauge built from moving averages — is the outlier. Its reading of 1.267 sits below the signal line at 1.398, leaving a negative histogram of −0.131. In plain terms: the longer trend is up, but short-term momentum has cooled. That is the sort of divergence that often accompanies a pause before a stock either re-accelerates or pulls back.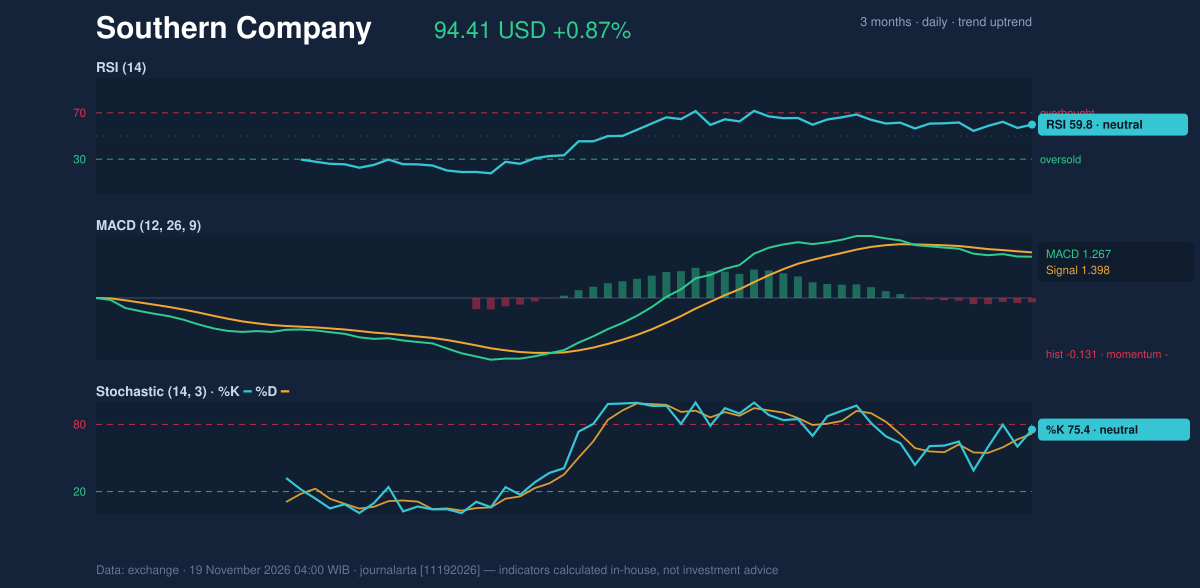
Volatility, Volume & the Squeeze
Volatility is the sleeper signal. The Bollinger band width — a measure of how spread out recent prices have been — has narrowed to 3.3%, a condition traders call a squeeze. A squeeze means the market is coiling, and historically such compression has preceded outsized moves in either direction, though it says nothing about which way. The stock's average true range (ATR, a measure of daily swing) is 1.97 USD, or about 2.1% of the price — moderate volatility. The upper Bollinger band rests at 94.90 and the lower at 91.80, with the price at 84% of the band width (%B), putting it close to the upper edge. Volume is the caution flag. Wednesday's turnover of 7,230,100 shares came in at 0.8× the 20-day average of roughly 8.65 million — thin participation. Still, the on-balance volume line is rising, meaning the volume that did trade leaned toward buying. That combination — shrinking volume but rising OBV — reads as patient accumulation rather than a chase.Fundamental Context
On the corporate side, Southern Company filed a Form 8-K with the U.S. Securities and Exchange Commission on 2026-11-17 reporting other material events, and a separate Form 8-K on 2026-11-05 reporting its results of operations and financial condition, according to its SEC filing. Utilities are watched closely for steady cash flows and dividend reliability, so the sequence of filings gives investors a fresh look at the company's operating footing.Key Levels & Scenarios
The near-term tension is defined by two lines: resistance at 94.64 and support at 91.52. A decisive move above 94.64 would, in chart terms, clear the top of the 20-day range and open the door toward the three-month high of 95.72. A failure to hold the 20-day average at 93.35 would put the 91.52 floor back in focus, with the lower Bollinger band at 91.80 sitting just above it as a secondary cushion. The squeeze is what gives those scenarios teeth — a market that compresses this tightly tends to resolve with a move that traders size against the ATR of 1.97 USD, not against signal-free drift.Technical Verdict: BUY
The technical case rests on three things. First, the trend is structurally sound: price above both the 20-day and 50-day averages, with the 20-day average above the 50-day and rising 0.97% over five sessions. Second, the pullback to the 20-day average within an uptrend is a constructive pattern, and the rising OBV confirms accumulation even in thin volume. Third, the Bollinger squeeze plus a neutral RSI at 59.8 means the advance is not overstretched. The verdict would be invalidated if price breaks below 91.07, the stop level, which would undermine the uptrend structure. - Entry range: 92.94 – 94.41 - Exit / target 1: 99.42 - Exit / target 2: 104.43 - Stop loss: 91.07 - Reward/risk: 1.5 to 3.0, valid through 17 December 2026 In plain English: the trend favors the stock, and Wednesday's push to the top of its range keeps it in play. This is technical analysis, not an investment recommendation; the site disclaimer applies.| Indikator | Nilai |
|---|---|
| Harga terakhir | 94.41 USD |
| Perubahan 1 hari | 0.87% |
| Perubahan 5 hari | 0.61% |
| Perubahan 1 bulan | 4.45% |
| SMA20 / SMA50 | 93.35 / 89.03 |
| Bollinger | atas 94.90 / tengah 93.35 / bawah 91.80 |
| RSI(14) | 59.8 (netral) |
| Stochastic | %K 75.4 / %D 71.7 |
| MACD | 1.267 / signal 1.398 / histogram −0.131 |
| ATR(14) | 1.97 (2.1%) |
| Support / Resistance 20h | 91.52 / 94.64 |
| High/Low 3 bulan | 95.72 / 81.69 |
Summary Data Southern Company
| Last price | 94.41 USD |
| Change 1 day / 5 days / 1 month | 0.87% / 0.61% / 4.45% |
| Trend / MA-cross | uptrend / none |
| SMA20 / SMA50 | 93.35 / 89.03 |
| RSI (14) / Stochastic %K | 59.8 / 75.4 |
| Bollinger %B / ATR | 84% / 1.97 |
| Support / Resistance 20 days | 91.52 / 94.64 |
| Data as of | 19 November 2026 04:00 WIB |
| JournalArta research verdict (score) | Buy (+84) |
| Entry zone | 92.94 – 94.41 |
| Target 1 / 2 | 99.42 / 104.43 |
| Stop loss | 91.07 |
| Reward/risk | 1.5 / 3.0 |
Today's full Buy and Sell list for US stocks →
Disclaimer: This technical analysis is generated automatically from exchange data and indicators calculated by JournalArta, for information and education only. The verdict and the entry, target and stop-loss levels are not investment advice or a solicitation to buy or sell any security. Investment decisions and their risks rest solely with the reader.
Track Southern Company stock price daily: live levels, support/resistance and our full Southern Company analysis history.
 Take the quizWhat Kind of Holiday Spender Are You? Take the Black Friday QuizStart →
- 1Gold Silver Price November: Futures Rise Near Yearly Lows

- 2U.S. Emergency Alert Test Nov. 17 Is Not a Power Outage

- 3Michael Clarke Says Sandpapergate Scars Drew Steve Smith to New York

- 42027 NFL Mock Draft Puts Ohio State’s Jeremiah Smith at No. 1

- 5Brent Crude Slides 4.05% as Rising US Stockpiles Weigh on Oil
 Lifestyle · Food & HealthWhat Is Raynaud’s Syndrome? Why Fingers Turn White in the Cold
 Lifestyle · Food & Health4 Ways Walking After Meals Helps Your Body, Doctors Say
 Lifestyle · Food & Health4 Reasons to Eat Oatmeal, According to Nutrition Experts
 Lifestyle7 Signs Your Social Battery Is Running Low (and Why You Keep Cancelling Plans)