Walmart (WMT) Stock on Wednesday: Falls 0.13%, Up 1.3% in Five Sessions
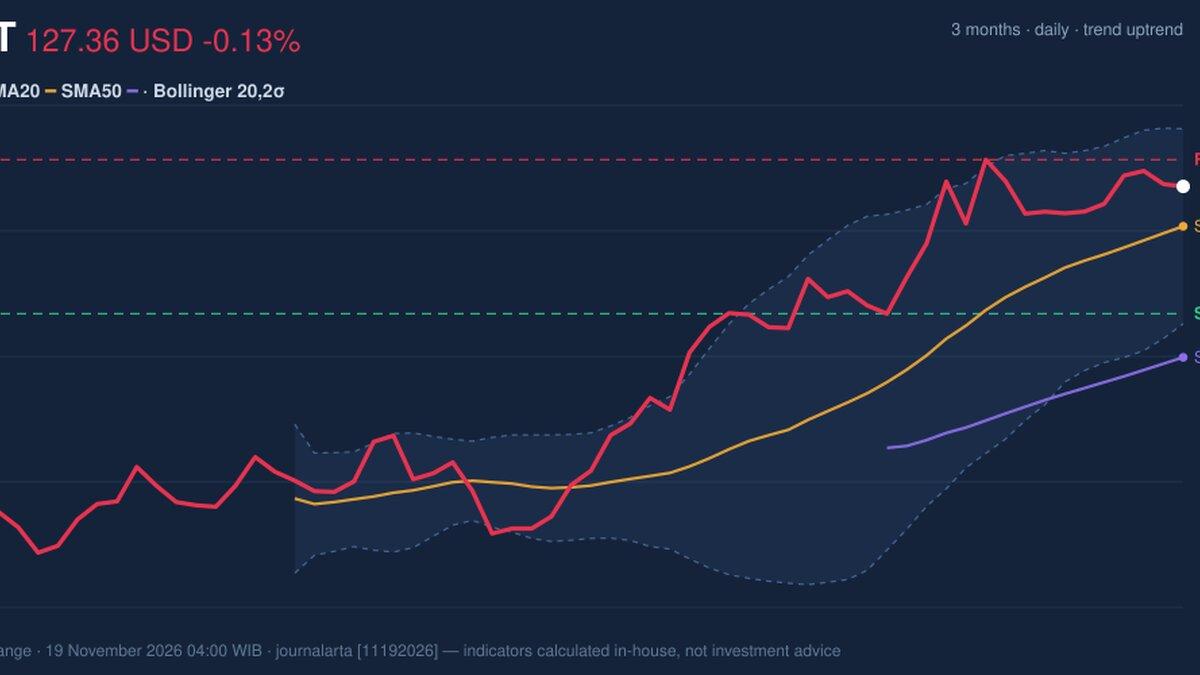
Technical analysis of WMT stock on November 18, 2026: price 127.36 USD, trend uptrend, RSI 64.1, support 118.77, resistance 129.17.
Why WMT is in focus today
Selected automatically from 11 NYSE (US) stocks by a technical-signal score with daily weighted randomisation — not a recommendation.
Trend & Price Action
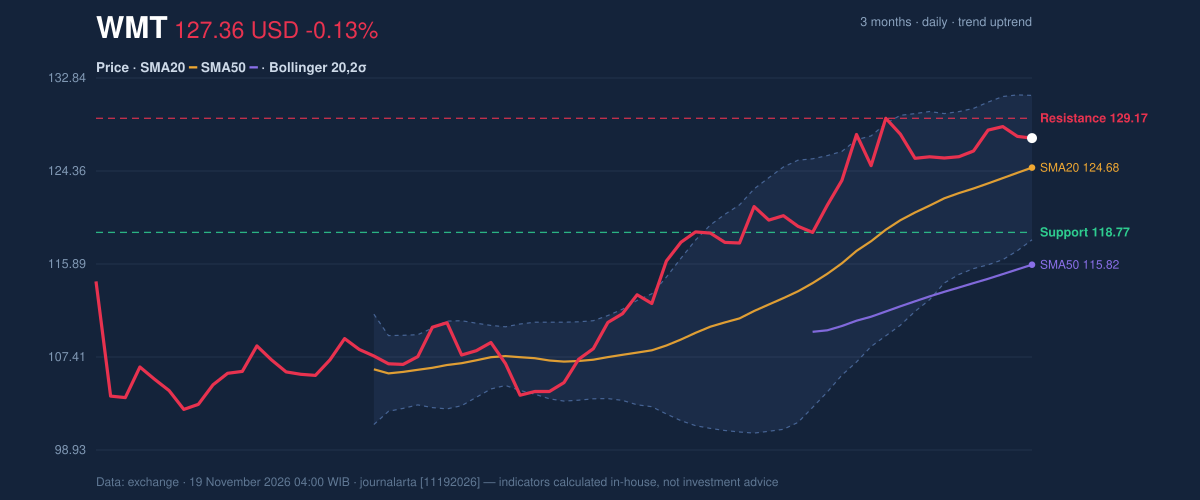
The structural picture is unambiguously positive. The shares sit well above both key averages — the 20-day SMA at $124.68 and the 50-day SMA at $115.82 — with the shorter average rising 1.90% over the past five sessions. That slope matters: it tells us the recent consolidation has been a pause in an uptrend, not a breakdown. No fresh moving-average cross has formed, which means this is a continuation setup rather than a new signal. What complicates the story is where the price sits relative to its Bollinger bands. The upper band is $131.26 and the lower $118.10, with the price at %B of 70% — elevated within the band but not yet riding the ceiling. Band width of 10.6% is normal, so there is no squeeze or expansion signal demanding a breakout. In plain terms: the stock has room to run toward the $129–$131 zone before mechanical selling pressure typically builds, but it is no longer cheap relative to its own recent volatility. The three-month high of $131.82 and low of $102.15 frame the recovery. The stock has climbed from the lower third of that range to near the top, and the $118.77 support — the 20-day floor — marks the line where the uptrend would first be questioned.Oscillators & Momentum
Here the picture gets more nuanced, and this is where the session’s signal deserves attention. The RSI(14) at 64.1 sits in neutral territory, but it is rolling over from above 65 — a bearish signal flagged by the data. That does not mean the trend is broken; it means the pace of buying has cooled. The Stochastic readings of %K 50.8 and %D 63.5 reinforce the same message: momentum is mid-range, neither oversold nor overbought, with the faster line below the slower one — a soft bearish tilt. The MACD at 3.372 against a signal line of 3.630 produces a negative histogram of -0.258. This is the clearest caution flag in the dataset: the trend is up, but short-term momentum has turned negative. The market is digesting gains, not accelerating.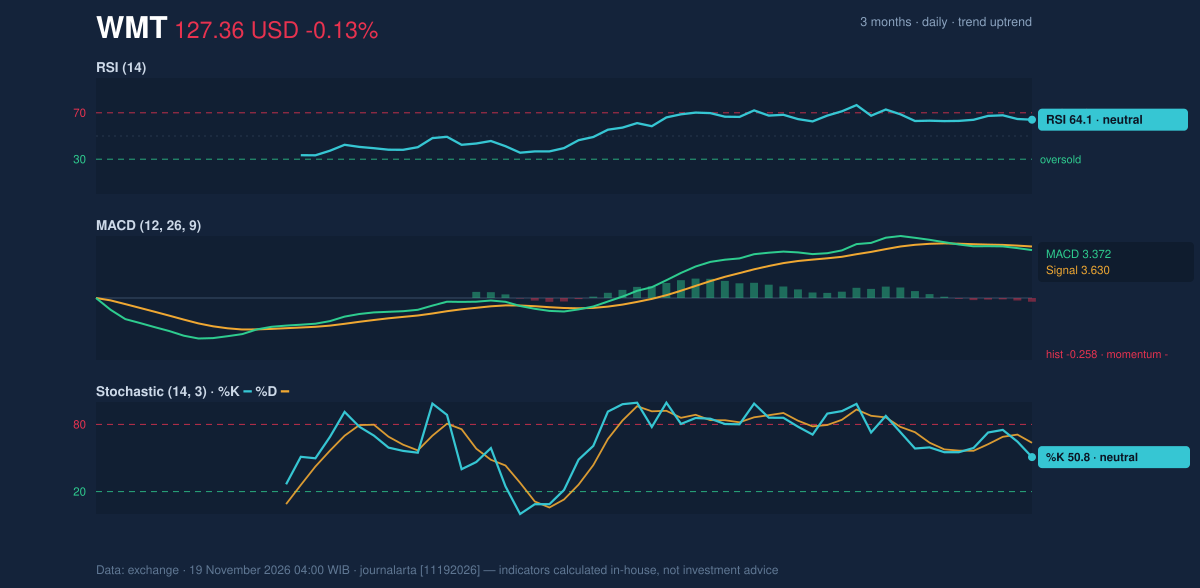
Volatility & Volume
The ATR(14) of 3.08, or 2.4% of the price, describes moderate volatility — enough to produce meaningful daily swings but not enough to suggest disorder. For context, a 2.4% average true range means a move of roughly $3 is unremarkable, and the stop-loss distance in the research levels reflects that. Volume is the more interesting signal. The latest session traded 27.9 million shares against a 20-day average of 22.3 million — 1.3 times normal. Elevated volume on a down day, combined with a falling On-Balance Volume, points to distribution: more selling pressure than the headline price change implies. That is a divergence worth flagging. The crowd is active, and it is leaning toward the exits even as the trend holds.Fundamental Context
The technical setup sits on a solid operating base. According to its SEC filing, Walmart reported quarterly revenue of $186.10 billion for the quarter ended July 31, 2026, up 5.9% from $175.75 billion a year earlier. Net income was $6.37 billion, down from $7.03 billion, with diluted earnings per share of $0.80 — margin pressure alongside top-line growth, a familiar mix for a retailer of this scale. Separately, a Form 8-K filed on November 16, 2026 reported a change of directors or officers, a governance event that may explain some of the recent volume and could keep volatility elevated near term.Key Levels & Scenarios
The actionable map is narrow. Resistance sits at $129.17, with the Bollinger upper band at $131.26 just beyond it and the three-month high of $131.82 forming the ceiling above that. A close above $129.17 on strong volume would confirm the uptrend and open the path toward the band. If the price fails to hold the 20-day SMA at $124.68, the next line of defence is the $118.77 support, which coincides with the lower Bollinger band at $118.10 — a cluster that would define the trend’s validity.Technical Verdict: BUY
The research call is BUY, with a score of +68 on a −100 to +100 scale. Three reasons carry the verdict: the price sits above its 50-day average and the 20-day average is above the 50-day, confirming an intact uptrend; the price has pulled back to the 20-day SMA within that uptrend, a classic continuation setup; and the RSI at 64.1 remains in the healthy 50–70 zone rather than overbought. The verdict would be invalidated if the price breaks below the stop level of $122.12.- Entry Range: $125.05 – $127.36
- Exit Target 1: $135.22
- Exit Target 2: $143.08
- Stop Loss: $122.12
- Reward/Risk: 1.5 / 3.0 (valid until 17 December 2026)
Summary Data WMT
| Last price | 127.36 USD |
| Change 1 day / 5 days / 1 month | -0.13% / 1.34% / 8.12% |
| Trend / MA-cross | uptrend / none |
| SMA20 / SMA50 | 124.68 / 115.82 |
| RSI (14) / Stochastic %K | 64.1 / 50.8 |
| Bollinger %B / ATR | 70% / 3.08 |
| Support / Resistance 20 days | 118.77 / 129.17 |
| Data as of | 19 November 2026 04:00 WIB |
| JournalArta research verdict (score) | Buy (+68) |
| Entry zone | 125.05 – 127.36 |
| Target 1 / 2 | 135.22 / 143.08 |
| Stop loss | 122.12 |
| Reward/risk | 1.5 / 3.0 |
Today's full Buy and Sell list for US stocks →
Disclaimer: This technical analysis is generated automatically from exchange data and indicators calculated by JournalArta, for information and education only. The verdict and the entry, target and stop-loss levels are not investment advice or a solicitation to buy or sell any security. Investment decisions and their risks rest solely with the reader.
Track WMT stock price daily: live levels, support/resistance and our full WMT analysis history.
 Take the quizWhat Kind of Holiday Spender Are You? Take the Black Friday QuizStart →
- 1Gold Silver Price November: Futures Rise Near Yearly Lows

- 2U.S. Emergency Alert Test Nov. 17 Is Not a Power Outage

- 3Michael Clarke Says Sandpapergate Scars Drew Steve Smith to New York

- 42027 NFL Mock Draft Puts Ohio State’s Jeremiah Smith at No. 1

- 5Brent Crude Slides 4.05% as Rising US Stockpiles Weigh on Oil
 Lifestyle · Food & HealthWhat Is Raynaud’s Syndrome? Why Fingers Turn White in the Cold
 Lifestyle · Food & Health4 Ways Walking After Meals Helps Your Body, Doctors Say
 Lifestyle · Food & Health4 Reasons to Eat Oatmeal, According to Nutrition Experts
 Lifestyle7 Signs Your Social Battery Is Running Low (and Why You Keep Cancelling Plans)