AMD Stock Week Ahead (November 23–27): What Comes After a 20.54% Weekly Loss
AMD stock week ahead for November 23–27: last close 424.39 USD, weekly change -20.54%, support 404.40, resistance 585.30.

Last Week in Review
Advanced Micro Devices fell -20.54% on a weekly basis, closing the session of November 20, 2026 at 424.39 USD on Nasdaq, down from the prior Friday's 534.06 USD. The weekly swing spanned a 32.54% range, from a high of 555.01 USD on November 19 to a low of 418.76 USD on the final session. The close sat in the bottom 4% of that band.
The week's structure was almost one-directional: four down sessions against a single up session.
Activity was heavy. Average daily volume across the week reached 49,817,880 shares, roughly 1.44 times the 34,692,840-share average of the prior 20 sessions. The final session carried 69,989,800 shares, about 1.7 times the 20-day figure, a clear sign that sellers, not apathy, drove the tape. That volume arrived on a down day, a pattern technical screens read as distribution.
Compared with a month ago, the stock is down -17.88%, meaning the bulk of the decline was concentrated into five sessions rather than spread across a slow grind.
Technical Map for the Week Ahead
Momentum readings on the daily chart give little comfort to either camp. The trend is described as a downtrend, with the 20-day simple moving average sloping -1.92% over five days. Price sits below both the 20-day average at 509.08 and the 50-day average at 553.10, and no fresh moving-average cross occurred. The 20-day average itself is below the 50-day.
The Relative Strength Index stands at 38.4, a neutral reading that lands in the 30 to 50 zone, short of the 30 level used to flag oversold conditions. Stochastic has separated: %K at 11.6 against %D at 41.2, an oversold signal on the faster line. MACD is negative at -16.166, with its signal at -12.639 and a histogram of -3.527, confirming that short-term momentum has rolled over.
Bollinger bands have widened sharply to a 37.3% width, a volatility expansion, with the lower band at 414.13, the middle at 509.08 and the upper at 604.03. The %B reading of 5% places price almost on the lower band, a stretched position within a widening range.
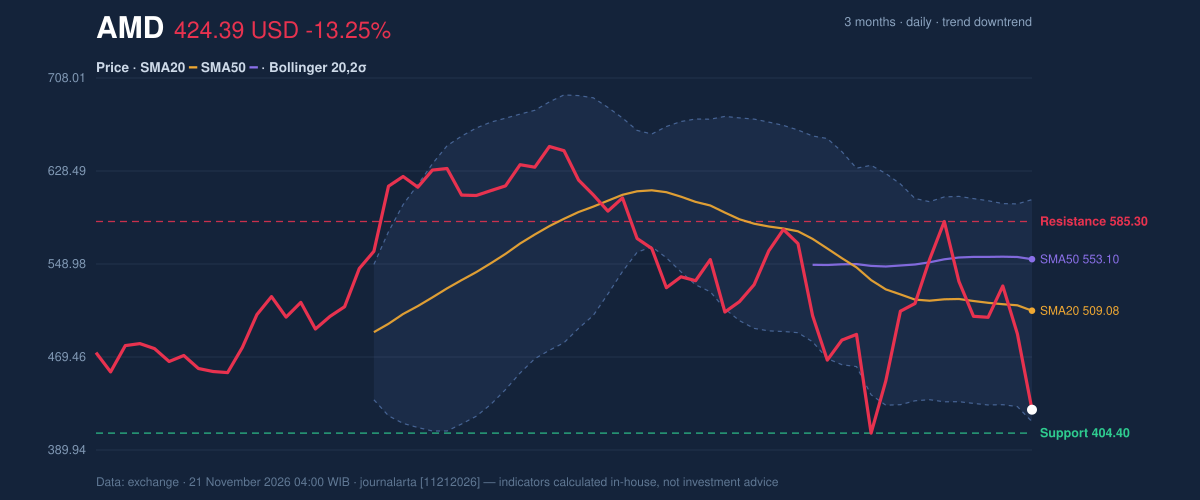
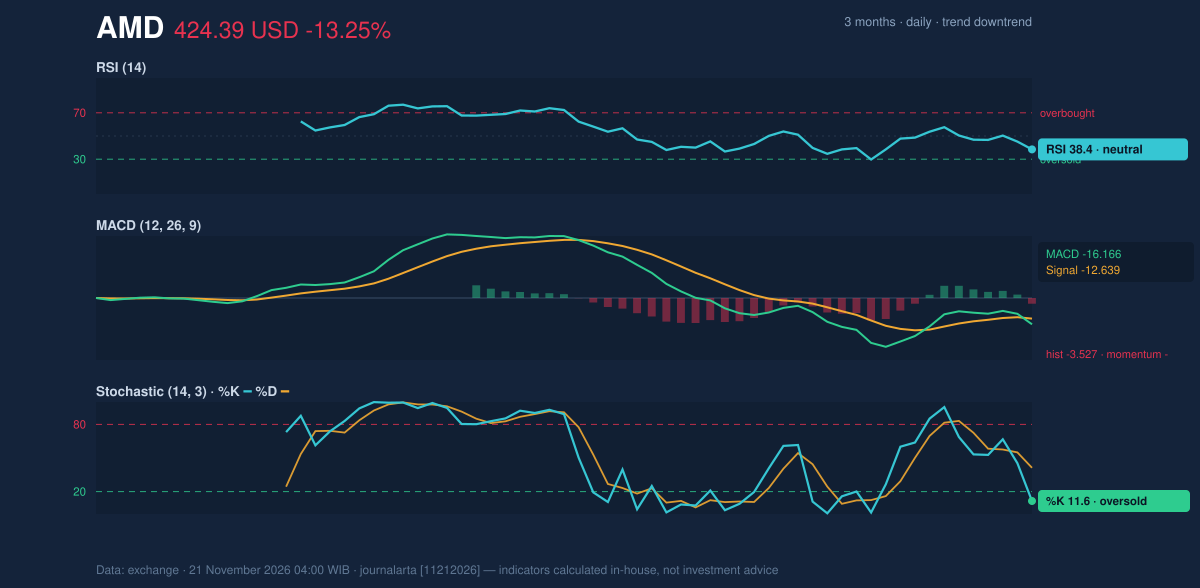
Looking at the price and momentum charts side by side, the stock closed the week barely above its 3-month low of 402.10 and well under the 3-month high of 658.52. The 20-day support rests at 404.40 and 20-day resistance at 585.30; the last close lies only about 11% through that 20-day range. Average True Range is 52.59 USD, equal to 12.4% of the share price, a high-volatility regime in which one session can cover a large share of the band.
For the bullish scenario, a decisive close above the 20-day resistance at 585.30 would be the trigger — a level more than a third above current price, and one that would first require reclaiming the 20-day average at 509.08 and the price-plus-1.5×ATR marker at 503.27. For the bearish scenario, a break below the 20-day support at 404.40 would open the path toward the 3-month low of 402.10, with the price-minus-1.5×ATR level at 345.51 the next reference further down.
Fundamentals and Catalysts
The price action sits awkwardly against the reported numbers. AMD reported quarterly revenue of $13.38 billion for the quarter ended September 26, 2026, up 44.7% from $9.25 billion a year earlier, according to its Form 10-Q filed on November 4, 2026. Net income for the same quarter was $2.43 billion, against $1.24 billion a year earlier, with diluted earnings per share of $1.46. A later revenue datapoint, published on November 20, 2026, put net revenue at $13.4 billion for the three months ended September 26, up 45% year over year.
On the corporate side, AMD announced on November 16, 2026 that it had completed its acquisition of World Labs, adding an AI research team and installing Dr. Fei-Fei Li as executive vice president and chief scientist. That deal closed during the week in which the stock lost a fifth of its value, a reminder that corporate news flow and share-price direction do not always move together.
The gap between those revenue and earnings figures and the week's slide means the move was not a reaction to the headline results themselves. What matters for readers is that the earnings base reported through early November remains the reference point against which the coming sessions will be measured.
The supply chain adds a second thread. TSMC's CoWoS advanced packaging capacity is tight, and Nvidia plans to invest billions of dollars to support ASE's Siliconware Precision Industries in expanding that capacity, according to a report published on November 8, 2026. Advanced packaging is a shared bottleneck for AI accelerator supply, so any expansion of capacity by a rival's partner is a competitive backdrop worth tracking.
Macro, Political and Global Factors
The research record for this week does not contain dated macro, political or policy items directly tied to AMD. The one global input available is the advanced packaging constraint described above, reported on November 8, 2026, in which TSMC's CoWoS capacity is described as tight while Nvidia plans billions of dollars of support for ASE's Siliconware Precision Industries to expand it. That is a supply-chain fact rather than a policy decision, and its relevance is structural: capacity allocation across AI chipmakers shapes the production outlook for the sector, not AMD's price on any given day.
Investors should read the absence of a fresh macro or policy catalyst in the record as a gap in disclosure, not as an all-clear.
Risks and What Would Invalidate the Scenario
The bearish case is the live one. The downtrend, negative MACD histogram and 20-day average below the 50-day average all point the same way, and the computed signal set carries 0 bullish versus 2 bearish readings, the bearish pair being the freshly negative MACD histogram and a downtrend confirmed by falling on-balance volume (OBV). A close below 404.40 would validate the downside path toward 402.10 and, on a deeper break, the 345.51 reference.
The upside case is not dead, but it is distant. To invalidate the bearish read, price would need to reclaim the 20-day average at 509.08 and then clear 20-day resistance at 585.30. Until then, each rally attempt sits beneath overhead supply.
Risks on the fundamental side include the gap between strong reported revenue and the market's willingness to pay for it, and the competitive pressure implied by tight CoWoS packaging capacity and a rival's investment in expanding it, both facts dated in the research record. Volatility is its own risk: an ATR equal to 12.4% of the share price means stop levels sit far from entry, which is precisely why the computed verdict declines to force a directional trade.
Technical Verdict for the Week: HOLD (wait & see)
The call is to hold and wait. The JournalArta research verdict scores the setup at -81 on a -100 to +100 scale, where +60 or above flags a buy and -60 or below a sell — a deeply negative score that nonetheless lands on hold because the stop required for a short position would sit too far from price given the 52.59 USD ATR. Three reasons underpin it.
First, price is below its 50-day average and the 20-day average is below the 50-day, with the trend confirmed as a downtrend. Second, RSI at 38.4 sits in the 30 to 50 zone and Stochastic %K at 11.6 is oversold, leaving room for a bounce without any confirmed reversal. Third, the -20.54% five-day drop came with volume at 1.7 times average on a down day, a distribution pattern that argues against chasing either direction.
The verdict is invalidated if price breaks below the 20-day support at 404.40, which would shift the balance toward a confirmed sell, or if it closes above the 20-day resistance at 585.30, which would reopen the bullish path.
- Entry Range: conditional — a close above 20-day resistance 585.30 for the upside scenario, or a break below 20-day support 404.40 for the downside scenario
- Target Price: 3-month high 658.52 in the upside scenario; 3-month low 402.10, with 345.51 as the next reference, in the downside scenario
- Stop Loss: 20-day support 404.40 beneath the upside setup; 20-day resistance 585.30 above the downside setup
In plain terms: the chart is too stretched and too volatile to justify a directional position this week, so the sensible stance is to wait for price to choose a side of the 404.40 to 585.30 range. The next scheduled event is the open of the session on Monday, November 23, 2026.
AMD Week Ahead Data
| Trading week | November 16 – November 20 (5 sessions) |
| Weekly change | -20.54% (534.06 → 424.39 USD) |
| Week high / low | 555.01 (November 19) / 418.76 (November 20) |
| Best / worst session | 5.31% (November 18) / -13.25% (November 20) |
| Avg daily volume vs prior 20 sessions | 49,817,880 vs 34,692,840 (1.44x) |
| SMA20 / SMA50 | 509.08 / 553.10 |
| RSI (14) / Stochastic %K | 38.4 / 11.6 |
| Support / Resistance 20 days | 404.40 / 585.30 |
| 3-month high / low | 658.52 / 402.10 |
| Week covered | November 23–27, 2026 |
| Data as of | 21 November 2026 04:00 WIB |
| JournalArta research verdict (score) | Hold (-81) |
Today's full Buy and Sell list for US stocks →
Disclaimer: This technical analysis is generated automatically from exchange data and indicators calculated by JournalArta, for information and education only. The verdict and the entry, target and stop-loss levels are not investment advice or a solicitation to buy or sell any security. Investment decisions and their risks rest solely with the reader.
Track AMD stock price daily: live levels, support/resistance and our full AMD analysis history.
 Take the quizWhat Kind of Holiday Spender Are You? Take the Black Friday QuizStart →
- 1Stock Market Today: Dow Slides 1.34% and VIX Jumps 15% at Midday

- 2Joachim Klement to Sell Stocks After S&P 500 Signal

- 3Stock Market Today: Nasdaq, S&P 500 Futures Slide as AI Selloff Deepens

- 4Kenneth Walker’s Groin Injury Puts Cardinals Game in Doubt

- 5Pat Cummins Faces Captaincy Doubts From Mitchell Johnson

 Lifestyle · Food & HealthNormal Blood Pressure Chart by Age: Healthy Ranges Explained
 Lifestyle · Food & HealthWhat Is Raynaud’s Syndrome? Why Fingers Turn White in the Cold
 Lifestyle · Food & Health4 Ways Walking After Meals Helps Your Body, Doctors Say
 Lifestyle · Food & Health4 Reasons to Eat Oatmeal, According to Nutrition Experts