INTC Stock Week Ahead: Levels and Scenarios for November 23–27
INTC stock week ahead for November 23–27: last close 51.28 USD, weekly change -14.05%, support 51.28, resistance 95.53.

Last Week in Review
The week began at 56.71, touched a high of 59.44 on Thursday, November 19, and then gave all of it back and more.
The pattern was lopsided. One session closed higher — Thursday, up 1.92% — and four closed lower, with Friday's -7.97% the worst of them. Volume averaged 126.7 million shares a day against a 20-session norm of 145.4 million, or 0.87x normal, meaning the decline was not driven by panic-scale turnover until the final session, when volume ran at about 1.4x the 20-day average. Over one month the stock has lost 41.03%, a move that has left the 20-day simple moving average at 64.90 and the 50-day at 90.22, both far above the current price.
Technical Map for the Week Ahead
The stock enters the November 23–27 week pinned at the floor of its recent range. It is at 0% of its 20-day support-to-resistance band, with support at 51.28 and resistance at 95.53; the three-month high is 127.44 and the three-month low 51.10. The 20-day moving average is falling at a slope of -11.99% over five days, and there is no fresh moving-average cross to suggest the trend is turning. Bollinger bands (20,2σ) are extremely wide — upper 93.77, middle 64.90, lower 36.04, bandwidth 88.9% — a signature of high volatility, with the price at just 26% of the band, near the lower edge.
Momentum is the interesting part. RSI(14) sits at 28.1, in oversold territory, and Stochastic %K is 1.4 against %D at 16.4, also oversold. MACD is deeply negative at -10.329 with a signal line of -10.667, but the histogram has just flipped to +0.338 — a hint that the pace of decline is easing even as the trend remains down. ATR(14) at 4.32, equal to 8.4% of the price, confirms that daily swings are wide enough to make any single session misleading.
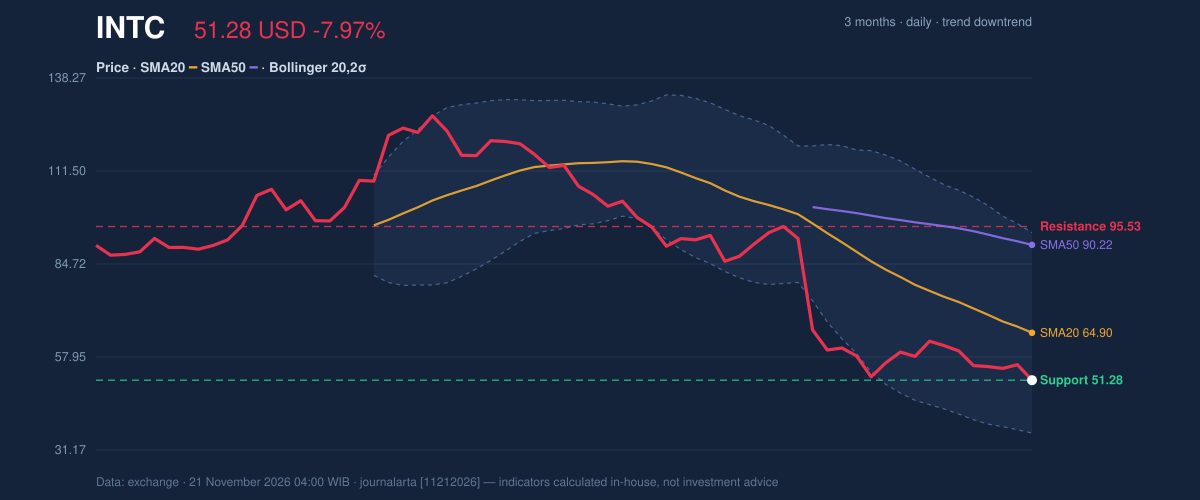
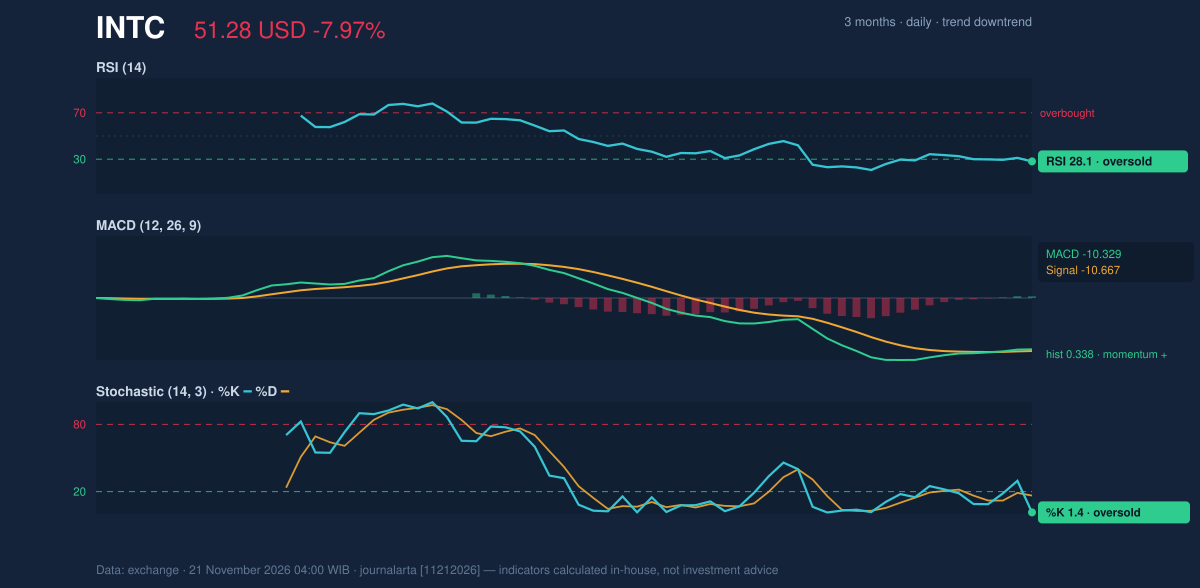
The charts tell a divided story: the price chart shows a stock pressed against the bottom of a three-month range, while the momentum chart shows oversold readings beginning to curl. In the bullish scenario, a close above the 20-day resistance at 95.53 would mark a genuine break of the current structure and open the path toward the three-month high of 127.44; the first step would be a reclaim of the falling 20-day average at 64.90. In the bearish scenario, a break below the 20-day support at 51.28 — and the 51.10 three-month low immediately beneath it — would confirm the downtrend and put the price minus 1.5×ATR level of 44.80 in play. On the upside, price plus 1.5×ATR sits at 57.76, the first area where overhead supply from last week's decline would likely emerge.
Fundamentals and Catalysts
The fundamental backdrop is double-edged. Intel reported quarterly revenue of $16.51 billion for the quarter ended September 26, 2026, up 20.9% from $13.65 billion a year earlier, according to its Form 10-Q filed October 30. Net income for the same quarter was $3.32 billion, down from $4.06 billion a year earlier, with diluted earnings per share of $0.60. So the top line is growing while the bottom line is compressing — a margin story the market has been pricing aggressively.
That pricing is visible in the relative performance. The same reporting noted that Intel expects revenue at its client computing unit — the business that houses its core PC chips — to fall more than 20% in the fourth quarter from the third. That guidance is the single most concrete bearish fact in the current record and helps explain why the stock is trading at the bottom of its range rather than mid-range. On the other side, the stock has a history of violent recoveries: in 9 of the last 10 calendar years, Intel shares rose 30% or more at some point, a reminder that this name's drawdowns have repeatedly been followed by sharp rebounds. There is also a reminder that sentiment can flip quickly within the sector: on Thursday, November 19, Nvidia, Dell Technologies, Micron Technology and Intel all advanced as renewed interest in artificial intelligence lifted semiconductor and data-center stocks.
Macro, Political and Global Factors
The research record for this week contains no dated macro, political-policy or global facts specific to Intel. The AI-driven rally in chips on November 19 shows the sector can still lift Intel on the right day, but it also shows how quickly that support evaporates — Thursday's gain was erased by Friday's 7.97% slide.
Risks and What Would Invalidate the Scenario
The primary risk to any stabilization thesis is the 20-day support at 51.28. A close below that level, and especially below the three-month low of 51.10, would invalidate the oversold-bounce case and confirm the downtrend, with the price minus 1.5×ATR level of 44.80 as the next reference. The falling 20-day average, down 11.99% over five days, and the price sitting below both the 20-day (64.90) and 50-day (90.22) averages, argue that rallies are more likely to be sold than sustained until proven otherwise.
Fundamentally, the client computing unit's expected more than 20% fourth-quarter revenue decline (reported November 20) is a live risk to forward earnings, and the year-on-year drop in net income to $3.32 billion from $4.06 billion shows the margin pressure is already in the numbers. On the other side, the bullish case would be invalidated by a failure to hold 51.28; a break above 95.53 would invalidate the bearish case. Volume is the swing factor — last week's average of 0.87x normal suggests conviction is thin, and a high-volume break in either direction would carry more weight than the price move alone.
Technical Verdict for the Week: HOLD (wait & see)
The verdict is HOLD (wait & see), consistent with the JournalArta research score of -50 on a −100 to +100 scale, which sits between the buy threshold of +60 and the sell threshold of −60. Trend and momentum are not aligned: the trend is clearly down, but the momentum indicators are stretched to the downside.
- Reason 1: Price at 51.28 is effectively on its 20-day support and just above the three-month low of 51.10 — a break either way is unresolved.
- Reason 2: RSI(14) at 28.1 and Stochastic %K at 1.4 are oversold, while the MACD histogram has turned positive at +0.338, signaling fading downside momentum.
- Reason 3: The 20-day average at 64.90 and 50-day at 90.22 remain far overhead, capping any rebound; ATR of 4.32 (8.4% of price) means the noise is too wide for a clean directional call.
- Invalidation: The verdict is invalidated if the price breaks below 51.28 (bearish confirmation) or closes above 95.53 (bullish confirmation).
Conditional levels from the reference set:
- Upside scenario entry: a close above the 20-day resistance at 95.53; target: the three-month high of 127.44; stop: the 20-day support at 51.28.
- Downside scenario entry: a break below the 20-day support at 51.28; target: price minus 1.5×ATR at 44.80; stop: price plus 1.5×ATR at 57.76.
In plain terms: the stock is oversold but still in a downtrend, so the sensible stance is to wait for the price to pick a side of its 51.28–95.53 range rather than anticipate the move.
INTC Week Ahead Data
| Trading week | November 16 – November 20 (5 sessions) |
| Weekly change | -14.05% (59.66 → 51.28 USD) |
| Week high / low | 59.44 (November 19) / 51.10 (November 20) |
| Best / worst session | 1.92% (November 19) / -7.97% (November 20) |
| Avg daily volume vs prior 20 sessions | 126,729,640 vs 145,374,445 (0.87x) |
| SMA20 / SMA50 | 64.90 / 90.22 |
| RSI (14) / Stochastic %K | 28.1 / 1.4 |
| Support / Resistance 20 days | 51.28 / 95.53 |
| 3-month high / low | 127.44 / 51.10 |
| Week covered | November 23–27, 2026 |
| Data as of | 21 November 2026 04:00 WIB |
| JournalArta research verdict (score) | Hold (-50) |
Today's full Buy and Sell list for US stocks →
Disclaimer: This technical analysis is generated automatically from exchange data and indicators calculated by JournalArta, for information and education only. The verdict and the entry, target and stop-loss levels are not investment advice or a solicitation to buy or sell any security. Investment decisions and their risks rest solely with the reader.
Track INTC stock price daily: live levels, support/resistance and our full INTC analysis history.
 Take the quizWhat Kind of Holiday Spender Are You? Take the Black Friday QuizStart →
- 1Stock Market Today: Dow Slides 1.34% and VIX Jumps 15% at Midday

- 2Joachim Klement to Sell Stocks After S&P 500 Signal

- 3Stock Market Today: Nasdaq, S&P 500 Futures Slide as AI Selloff Deepens

- 4Kenneth Walker’s Groin Injury Puts Cardinals Game in Doubt

- 5Pat Cummins Faces Captaincy Doubts From Mitchell Johnson

 Markets · FintechHow to Calculate Compound Interest: Formula, Examples and the Rule of 72
 Lifestyle · Food & HealthNormal Blood Pressure Chart by Age: Healthy Ranges Explained
 Lifestyle · Food & HealthWhat Is Raynaud’s Syndrome? Why Fingers Turn White in the Cold
 Lifestyle · Food & Health4 Ways Walking After Meals Helps Your Body, Doctors Say