CSCO Stock Week Ahead: Technical Outlook for November 16–20
CSCO stock week ahead for November 16–20: last close 95.64 USD, weekly change 1.91%, support 93.85, resistance 111.38.

Cisco Systems (NASDAQ: CSCO) heads into the week of November 16–20 at $95.64, after a Friday session that erased the gains from a post-earnings rally. The stock lost 6.24% on November 13, falling from a prior close of $102.01. That left it within a whisker of its 20-day support and its three-month low.
Last Week in Review
Over the five sessions from November 9 to November 13, CSCO rose 1.91%, closing at $95.64 against $93.85 on November 6. The path was uneven. The best session came first: +5.11% on November 9, with the week's low of $94.97 printed that same day. The stock then climbed to a weekly high of $103.18 on November 12, the day Cisco reported its results.
The reversal on November 13 was the worst session of the week at -6.24%. Three sessions closed higher and two lower. The weekly range was 8.64%, and Friday's close sat at just 8% of it, near the bottom. Volume ran hot: the daily average was 22,507,820 shares, or 1.22 times the 18,499,710 average of the prior 20 sessions. Friday's 28,592,200 shares were 1.4 times the 20-day norm, and on-balance volume turned down, a sign that selling carried the heavier volume.
Over one month the stock is down 10.94%.
Technical Map for the Week Ahead
The trend reading is a downtrend. The 20-day moving average (SMA20) is sloping down 3.09% over five days, and the price sits below both the SMA20 at $103.49 and the SMA50 at $107.76. No new moving-average crossover has formed. The slope figure describes the average, not the stock's own price change.
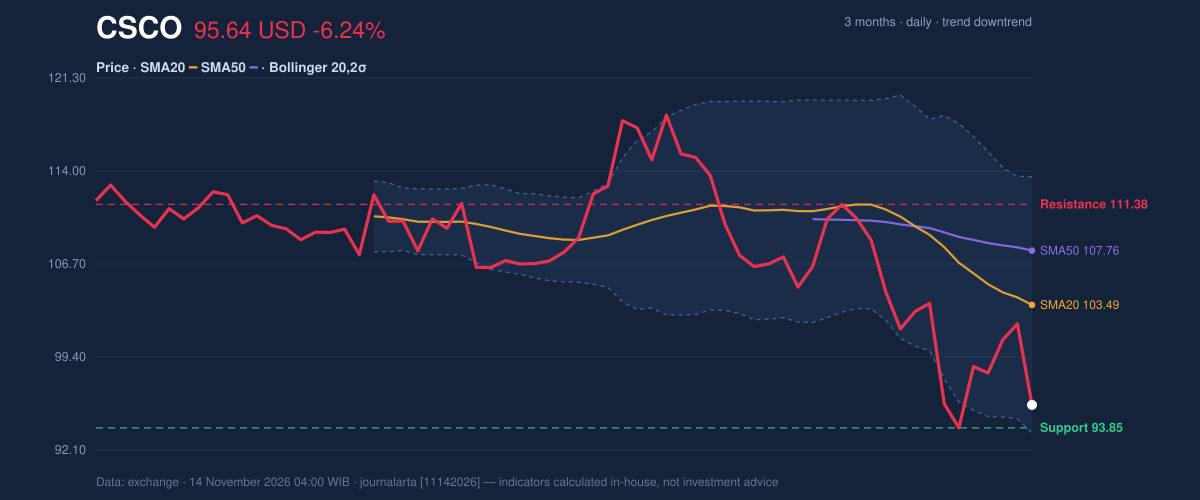
The chart shows how little room lies between the close and the floor. The 20-day support is $93.85, the level where the previous week closed, and the three-month low is $93.35. Overhead, the 20-day resistance is $111.38 and the three-month high is $118.65. The price sits at 10% of the 20-day range.
The lower Bollinger Band is at $93.43, so the close is hugging it. %B reads 11%, and the band width of 19.4% is normal rather than stretched. The upper band is at $113.55 and the middle band at $103.49.
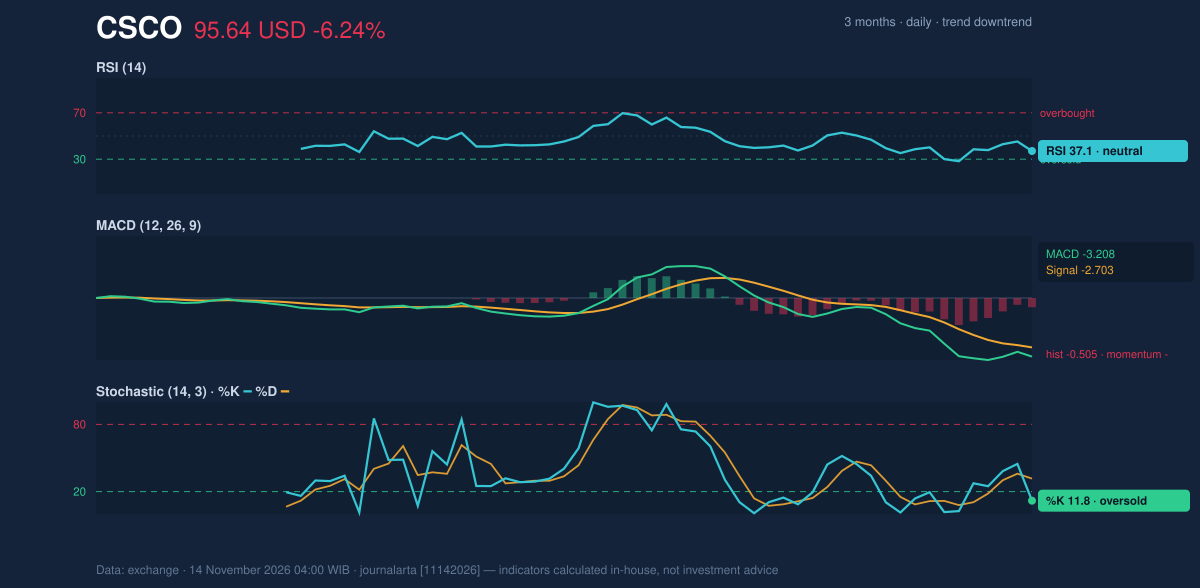
Momentum, shown above, is soft but not extreme. The 14-day RSI is 37.1, in neutral territory above the 30 oversold line. The Stochastic is more stretched, with %K at 11.8 and %D at 31.6, which counts as oversold. The MACD line is -3.208 against a signal of -2.703, a histogram of -0.505 and negative momentum. The 14-day average true range (ATR, a gauge of daily swing size) is $4.17, or 4.4% of the price, so volatility is high.
Bullish scenario: a close above the 20-day resistance at $111.38 would break the downtrend's ceiling. It would also put the price above both moving averages and bring the $118.65 three-month high into view. The price would need to travel more than 16% from Friday's close to get there.
Bearish scenario: a slip below the $93.85 support, and then the $93.35 three-month low, would open a new low for the period. The ATR-based level at $89.39 (price minus 1.5 times ATR) marks where that move could extend.
Fundamentals and Catalysts
Friday's drop came against a strong earnings report, and the research available here does not explain it. Cisco filed a Form 8-K on November 12 reporting its results. According to reports published on November 13, fiscal first-quarter 2027 revenue was $18.5 billion, up 24% year over year, for the quarter ended October 24. GAAP net income was $4.6 billion, or $1.14 per share, against $2.9 billion, or $0.72, a year earlier.
Non-GAAP earnings per share of $1.40 and revenue of $18.5 billion beat LSEG consensus estimates of $1.33 and $18.1 billion, respectively, as reported on November 13. Cisco also raised its fiscal 2027 revenue and non-GAAP EPS guidance, according to the same date's reports.
The longer record is solid. Cisco's annual report, filed on September 2, showed fiscal 2026 revenue of $63.33 billion, up 11.8% from $56.65 billion. Net income was $13.27 billion against $10.18 billion a year earlier, with diluted EPS of $3.33. Strong results, a guidance raise and a falling share price do not fit together neatly. The data show volume and selling pressure, but they do not show why.
Macro, Political and Global Factors
The research block contains no macroeconomic, policy or global facts for CSCO this week, and it lists no scheduled company event for November 16–20. This analysis therefore does not assume any. Without a dated catalyst on the calendar, price levels carry more of the weight for the next five sessions.
Risks and What Would Invalidate the Scenario
The bearish case is invalidated if the stock recovers the SMA20 at $103.49 and holds it. A close back above that level would put the price above the middle Bollinger Band and reverse the slope-driven reading. The $101.89 level (price plus 1.5 times ATR) is the first hurdle on that path.
The bullish case fails on a break of the $93.85 support. With the price already at the lower Bollinger Band and the Stochastic oversold, a bounce is possible, but the signal count is thin: code-computed signals show one bullish (RSI rebounding from below 35) and one bearish (downtrend confirmed by falling OBV).
The main risk from the research is the disconnect itself. The shares fell 6.24% on the day after results that beat consensus and came with raised guidance. Why they fell is not stated in the research, so any explanation would be speculation.
Technical Verdict for the Week: HOLD (wait & see)
JournalArta's research score for CSCO is -50 on a scale running from -100 to +100, short of the -60 threshold that would produce a sell reading. The call is HOLD (wait & see), because trend and momentum are not yet aligned.
- Trend is negative: the price is below the SMA50 at $107.76, the SMA20 is below the SMA50, and the SMA20 slope is -3.09%.
- Momentum is weak but not washed out: RSI at 37.1, MACD histogram at -0.505, while the Stochastic at 11.8 is oversold.
- Volume is lopsided: Friday's session ran at 1.4 times the 20-day average with OBV falling.
The verdict is invalidated if the price closes below $93.85 (downside breaks the 20-day support) or above $111.38 (upside breaks the 20-day resistance). The levels below are conditional scenarios from the reference levels, not recommendations.
- Upside scenario: Entry Range: a close above $111.38. Target Price: $118.65 (three-month high). Stop Loss: $103.49 (SMA20).
- Downside scenario: Entry Range: a break below $93.85. Target Price: $89.39 (price minus 1.5 times ATR). Stop Loss: $101.89 (price plus 1.5 times ATR).
In plain terms, the chart is stuck between two lines, $93.85 below and $111.38 above, and the data do not yet say which one the stock will cross first.
CSCO Week Ahead Data
| Trading week | November 9 – November 13 (5 sessions) |
| Weekly change | 1.91% (93.85 → 95.64 USD) |
| Week high / low | 103.18 (November 12) / 94.97 (November 9) |
| Best / worst session | 5.11% (November 9) / -6.24% (November 13) |
| Avg daily volume vs prior 20 sessions | 22,507,820 vs 18,499,710 (1.22x) |
| SMA20 / SMA50 | 103.49 / 107.76 |
| RSI (14) / Stochastic %K | 37.1 / 11.8 |
| Support / Resistance 20 days | 93.85 / 111.38 |
| 3-month high / low | 118.65 / 93.35 |
| Week covered | November 16–20, 2026 |
| Data as of | 14 November 2026 04:00 WIB |
| JournalArta research verdict (score) | Hold (-50) |
Today's full Buy and Sell list for US stocks →
Disclaimer: This technical analysis is generated automatically from exchange data and indicators calculated by JournalArta, for information and education only. The verdict and the entry, target and stop-loss levels are not investment advice or a solicitation to buy or sell any security. Investment decisions and their risks rest solely with the reader.
Track CSCO stock price daily: live levels, support/resistance and our full CSCO analysis history.