INTC Stock Week Ahead (November 16–20): What Comes After a 6.01% Weekly Gain
INTC stock week ahead for November 16–20: last close 59.66 USD, weekly change 6.01%, support 52.25, resistance 95.53.
Intel closed Friday, November 13, at $59.66, up 6.01% on the week but down 33.60% over one month. The stock heads into the November 16–20 week below both its 20-day and 50-day averages, with a computed research score of -58 that sits just short of the sell threshold.
Last Week in Review
Gains came early and faded late. Intel closed the prior week (November 6) at $56.28 and opened the first session of the week at $56.86. The weekly low of $55.83 came on Monday, November 9. The high of $64.06 followed on Wednesday, November 11, the best session of the week at +7.52%.
Then it slipped. Friday, November 13, was the worst session at -2.52%, with the stock closing at $59.66 against a previous close of $61.20.
Volume was lighter than usual. Daily turnover averaged 112,885,920 shares, or 0.78x the 20-session average of 143,999,265. A rebound on thinner volume carries less weight than one on heavy volume.
Technical Map for the Week Ahead
The trend is still down. The 20-day moving average (SMA20) sits at 73.74 and the 50-day (SMA50) at 94.97, with the price below both. The slope of the SMA20 is -11.23% over five days. That figure describes the average, not the stock's own move. No new moving-average crossover has formed.
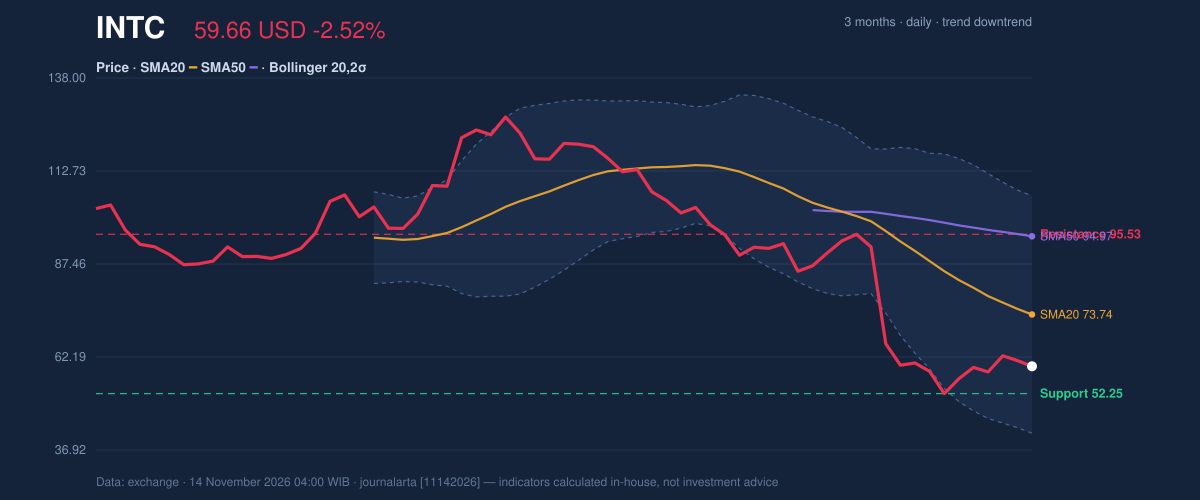
The 20-day support is 52.25 and the 20-day resistance is 95.53, which puts the price at 17% of that range. Over three months, the high is 127.44 and the low is 51.51. The 3-month low sits just under the 20-day support, so the two levels form a tight floor.
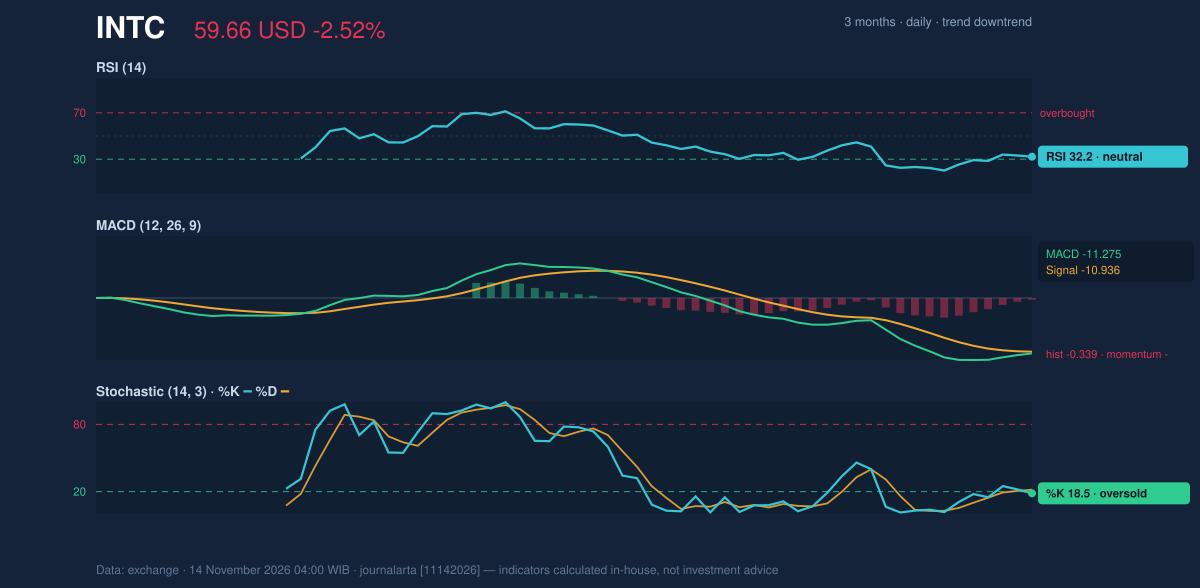
Momentum is weak but not extreme. RSI(14) is 32.2, in neutral territory and close to the oversold line. The Stochastic reads %K 18.5 and %D 21.8, which is oversold. MACD is -11.275 against a signal line of -10.936, a histogram of -0.339. Momentum is still negative, though the gap is narrow.
Bollinger Bands (20, 2σ) run from a lower band of 41.51 through a middle of 73.74 to an upper band of 105.98. The bands are wide, at 87.4% of the middle line, and widening, which signals high volatility. %B is 28%. The ATR(14) is 6.22, or 10.4% of the price, so a daily move of several dollars would be routine. On-balance volume (OBV) is falling, which confirms the downtrend rather than contradicting it.
Bullish scenario: if the stock closes above the 20-day resistance at 95.53, the downtrend would be challenged. The price would first need to recover the SMA20 at 73.74. Price plus 1.5×ATR gives 68.99, a nearer reference point for how far a normal swing could carry it.
Bearish scenario: if the stock slips below the 20-day support at 52.25, it would open the 3-month low of 51.51 and then the price minus 1.5×ATR level of 50.33.
Fundamentals and Catalysts
The quarterly numbers were solid. Intel reported revenue of $16.51 billion for the quarter ended September 26, up 20.9% from $13.65 billion a year earlier, in a Form 10-Q filed October 30.
Profit moved the other way. Net income was $3.32 billion, compared with $4.06 billion a year earlier, and diluted earnings per share were $0.60, according to the same filing.
A report published November 13 described CEO Lip-Bu Tan as having worked all year to return Intel to top-tier status among tech companies and investors. It said that for much of 2026 the progress was clear, particularly on the sales and profit lines. It credited Tan's network of contacts for new business, a reinvigorated engineering culture, and sweeping cost cuts.
The same report noted that Intel's stock hit a record high of $135 in mid-June. At $59.66, the shares trade well below that level. The research material gives no scheduled company event for November 16–20, so no earnings or dividend date is cited here.
Macro, Political and Global Factors
The research material supplied for this week contains no macro, policy or global facts. This analysis therefore does not attribute Intel's one-month slide to any outside factor.
Risks and What Would Invalidate the Scenario
Volatility is the first risk. With the ATR at 10.4% of the price and the Bollinger Bands widening, single sessions can overwhelm a weekly view. Friday's -2.52% drop came after a +7.52% day, which shows how quickly sentiment has swung.
The downside case breaks if the stock cannot hold 52.25. A close below that level, with the 3-month low at 51.51 just beneath it, would leave little nearby support in the data.
The upside case needs more than a bounce. Weekly volume ran at 0.78x the recent average, and OBV is still falling. Both suggest buyers have not yet returned in force. The price also remains below the SMA20 at 73.74, which would need to be reclaimed before any broader recovery could be called.
On the fundamentals, revenue growth of 20.9% sits beside lower net income than a year ago. That mix leaves room for investors to read the quarter in either direction.
Technical Verdict for the Week: HOLD (wait & see)
JournalArta's research score for Intel is -58 on a scale where -60 or below is a sell reading and +60 or above is a buy reading. The call is HOLD (wait & see), because trend and momentum are not yet aligned.
The strongest reasons:
- Trend: the price is below the SMA20 (73.74) and SMA50 (94.97), and the SMA20 is below the SMA50, a confirmed downtrend with falling OBV.
- Momentum: RSI(14) at 32.2 and Stochastic %K at 18.5 are near oversold, which tempers the bearish reading.
- Signals: zero bullish against one bearish technical signal, so neither side has a clear edge.
The verdict is invalidated if the price breaks below 52.25 or closes above 95.53.
Conditional levels, drawn only from the reference levels in the data:
- Upside scenario (if price closes above 95.53): entry range 95.53–105.98 (20-day resistance to upper Bollinger Band); target price 127.44 (3-month high); stop loss 73.74 (SMA20).
- Downside scenario (if price breaks 52.25): entry range 51.51–52.25 (3-month low to 20-day support); target price 41.51 (lower Bollinger Band); stop loss 59.66 (last close).
In plain terms: Intel has bounced from its lows but remains in a downtrend, so the chart does not yet support a firm call in either direction. This is technical analysis, not an investment recommendation.
The 10-Q filed October 30 put Intel's quarterly net income at $3.32 billion, against $4.06 billion a year earlier.
INTC Week Ahead Data
| Trading week | November 9 – November 13 (5 sessions) |
| Weekly change | 6.01% (56.28 → 59.66 USD) |
| Week high / low | 64.06 (November 11) / 55.83 (November 9) |
| Best / worst session | 7.52% (November 11) / -2.52% (November 13) |
| Avg daily volume vs prior 20 sessions | 112,885,920 vs 143,999,265 (0.78x) |
| SMA20 / SMA50 | 73.74 / 94.97 |
| RSI (14) / Stochastic %K | 32.2 / 18.5 |
| Support / Resistance 20 days | 52.25 / 95.53 |
| 3-month high / low | 127.44 / 51.51 |
| Week covered | November 16–20, 2026 |
| Data as of | 14 November 2026 04:00 WIB |
| JournalArta research verdict (score) | Hold (-58) |
Today's full Buy and Sell list for US stocks →
Disclaimer: This technical analysis is generated automatically from exchange data and indicators calculated by JournalArta, for information and education only. The verdict and the entry, target and stop-loss levels are not investment advice or a solicitation to buy or sell any security. Investment decisions and their risks rest solely with the reader.
Track INTC stock price daily: live levels, support/resistance and our full INTC analysis history.